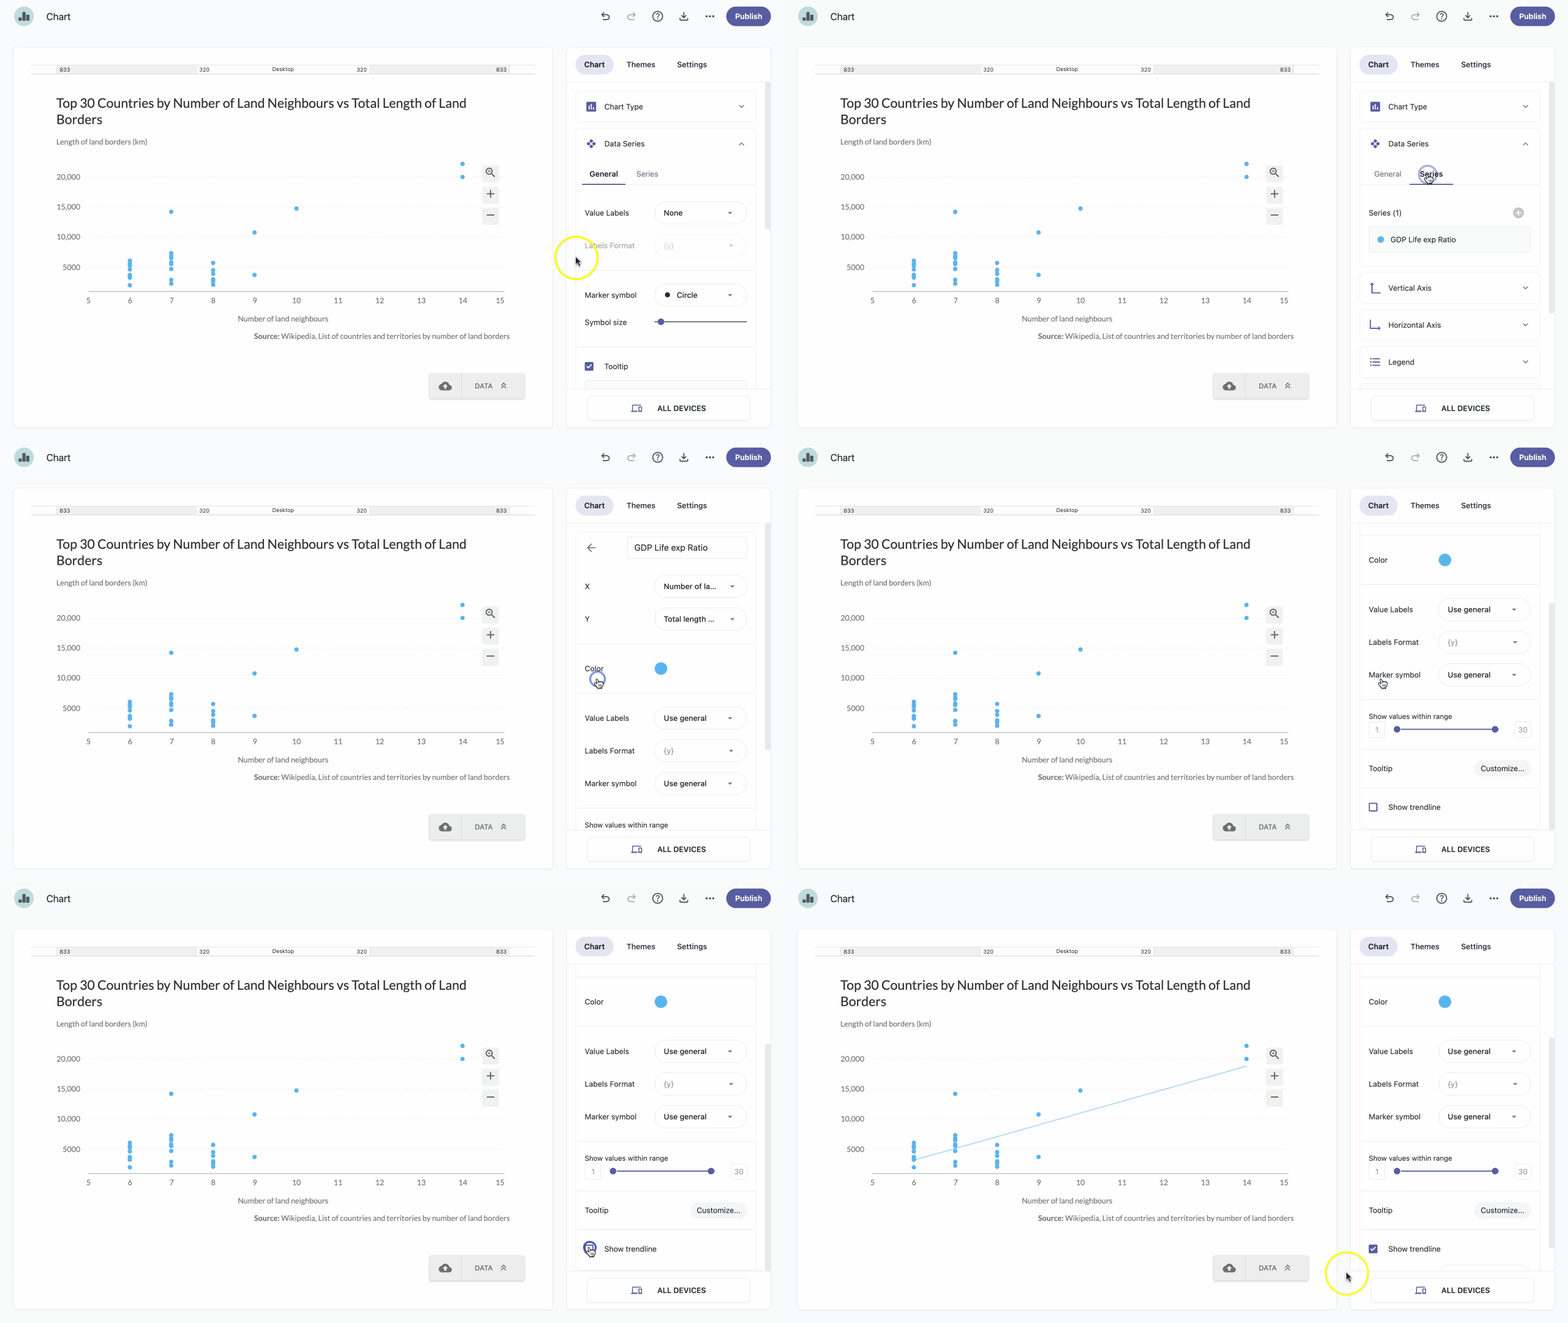
Trendline is used to visualize the general pattern or direction of a data series. Trendlines help determine increases or decreases, separating them from random variations.
| Note: Trendline option is available only for Scatter and Bubble chart types. |
- In the chart panel, click Data Series to open the dropdown menu.
- Open the Series tab, and click a series to expand it.
- Check the box next to Show trendline.
- From the Type dropdown, select the trendline type.