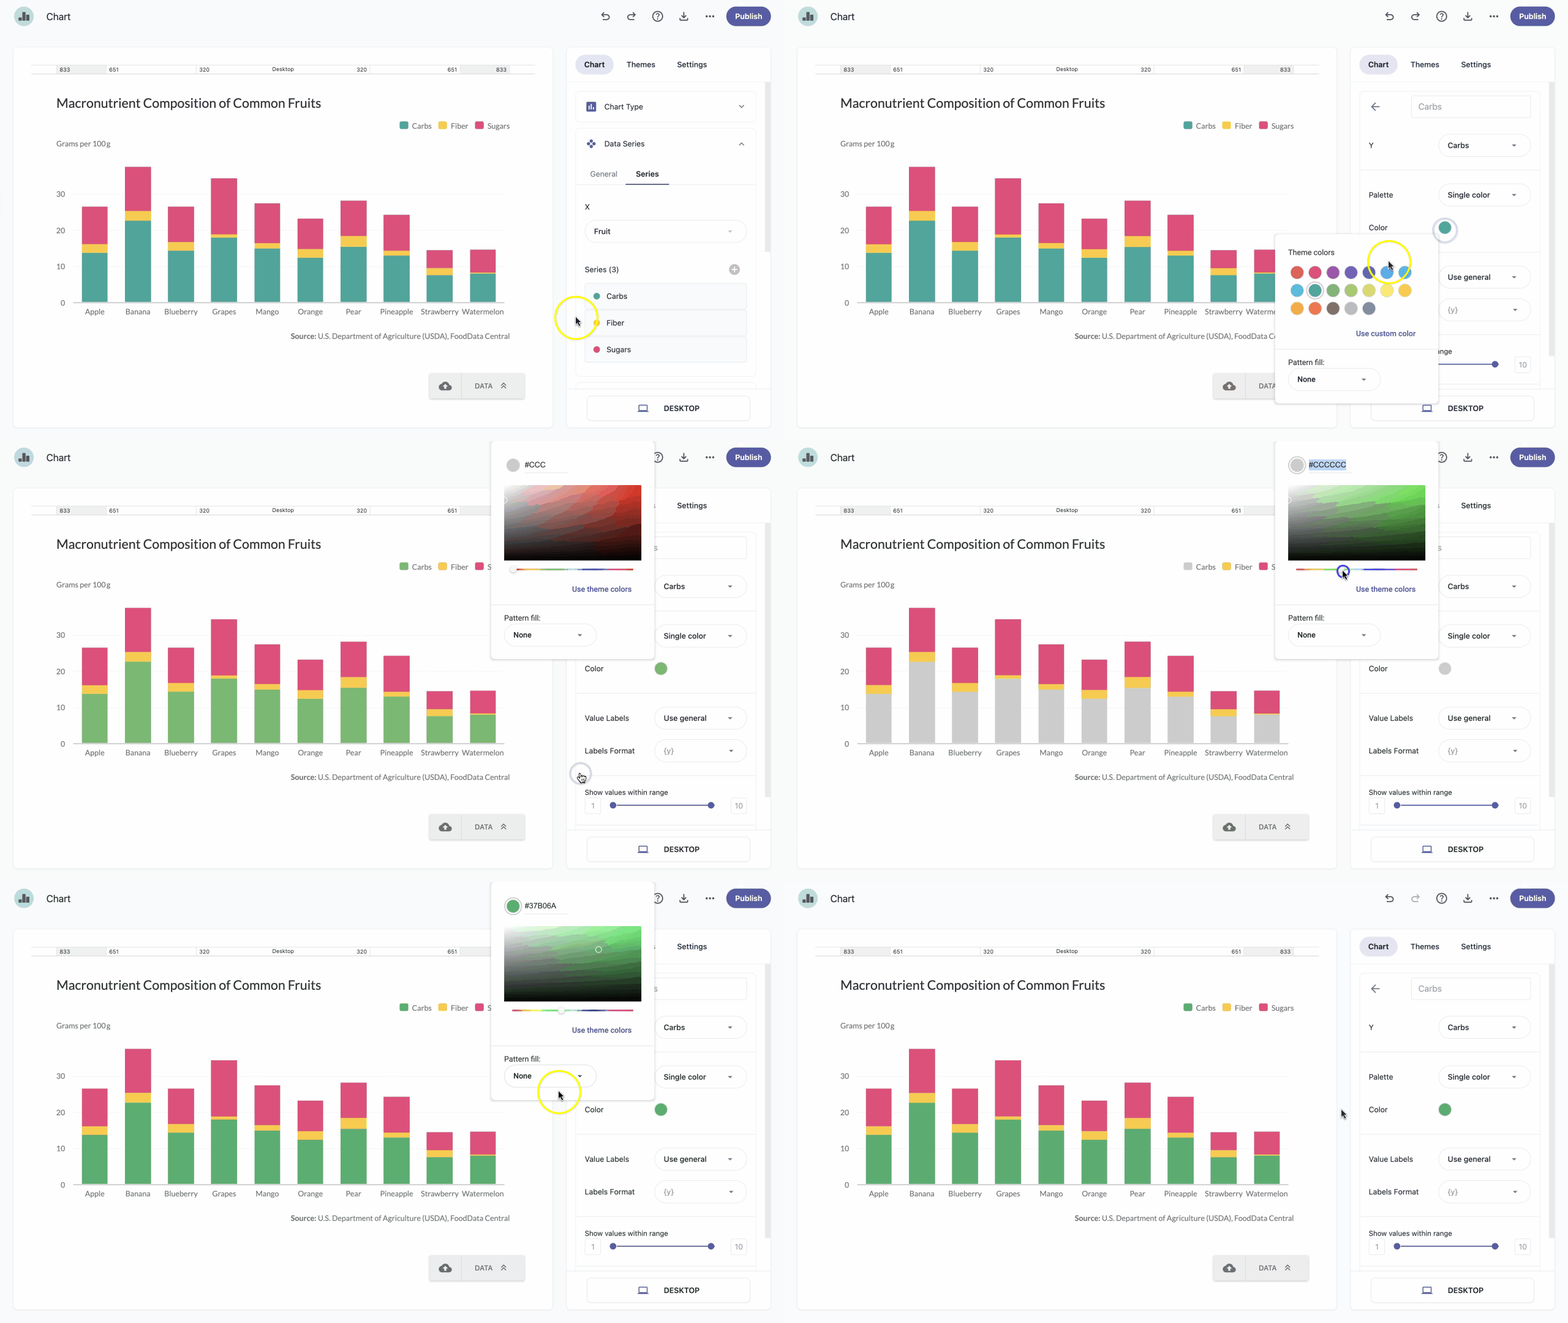
Change series color
Color is one of the most effective ways to distinguish between different series or to highlight a specific one.
- In the chart panel, click Data Series to open the dropdown menu.
In the Series tab, click the series to expand it.
Note: A quicker way to select a series is to click it directly on the chart. - Click the color circle.
Select one of the theme colors, or choose a custom color by entering a color code or using the color picker.
Note: The Color by point option assigns different colors to each value in the series. - Click outside the menu to close the color picker.
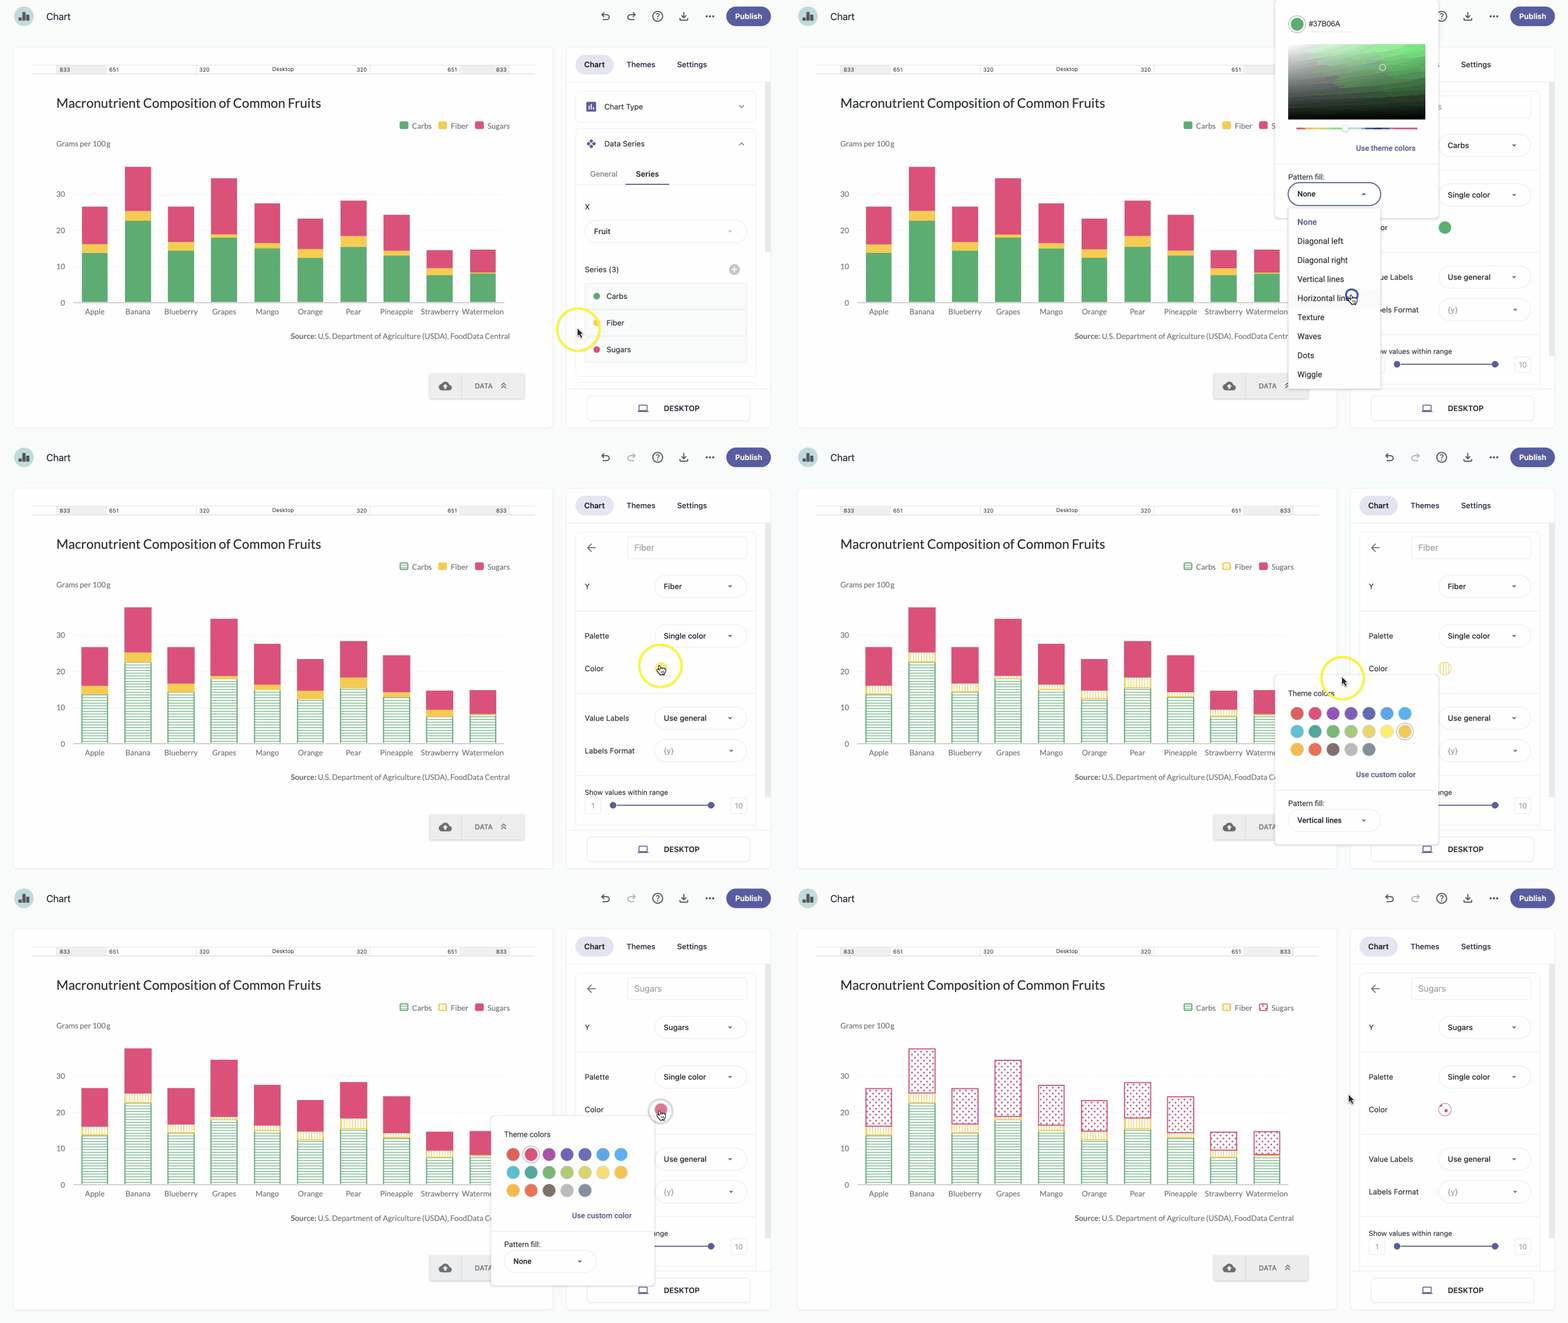
Add pattern fills
Ensure accessibility and help color-blind users read your charts more easily by using pattern fills. Most chart types now support eight different patterns.
- In the chart panel, click Data Series to open the dropdown menu.
In the Series tab, click the series to expand it.
Note: A quicker way to select a series is to click it directly on the chart. - Click the color circle.
- Choose one of the eight patterns from the Pattern fill dropdown.
- Click away to close the menu.