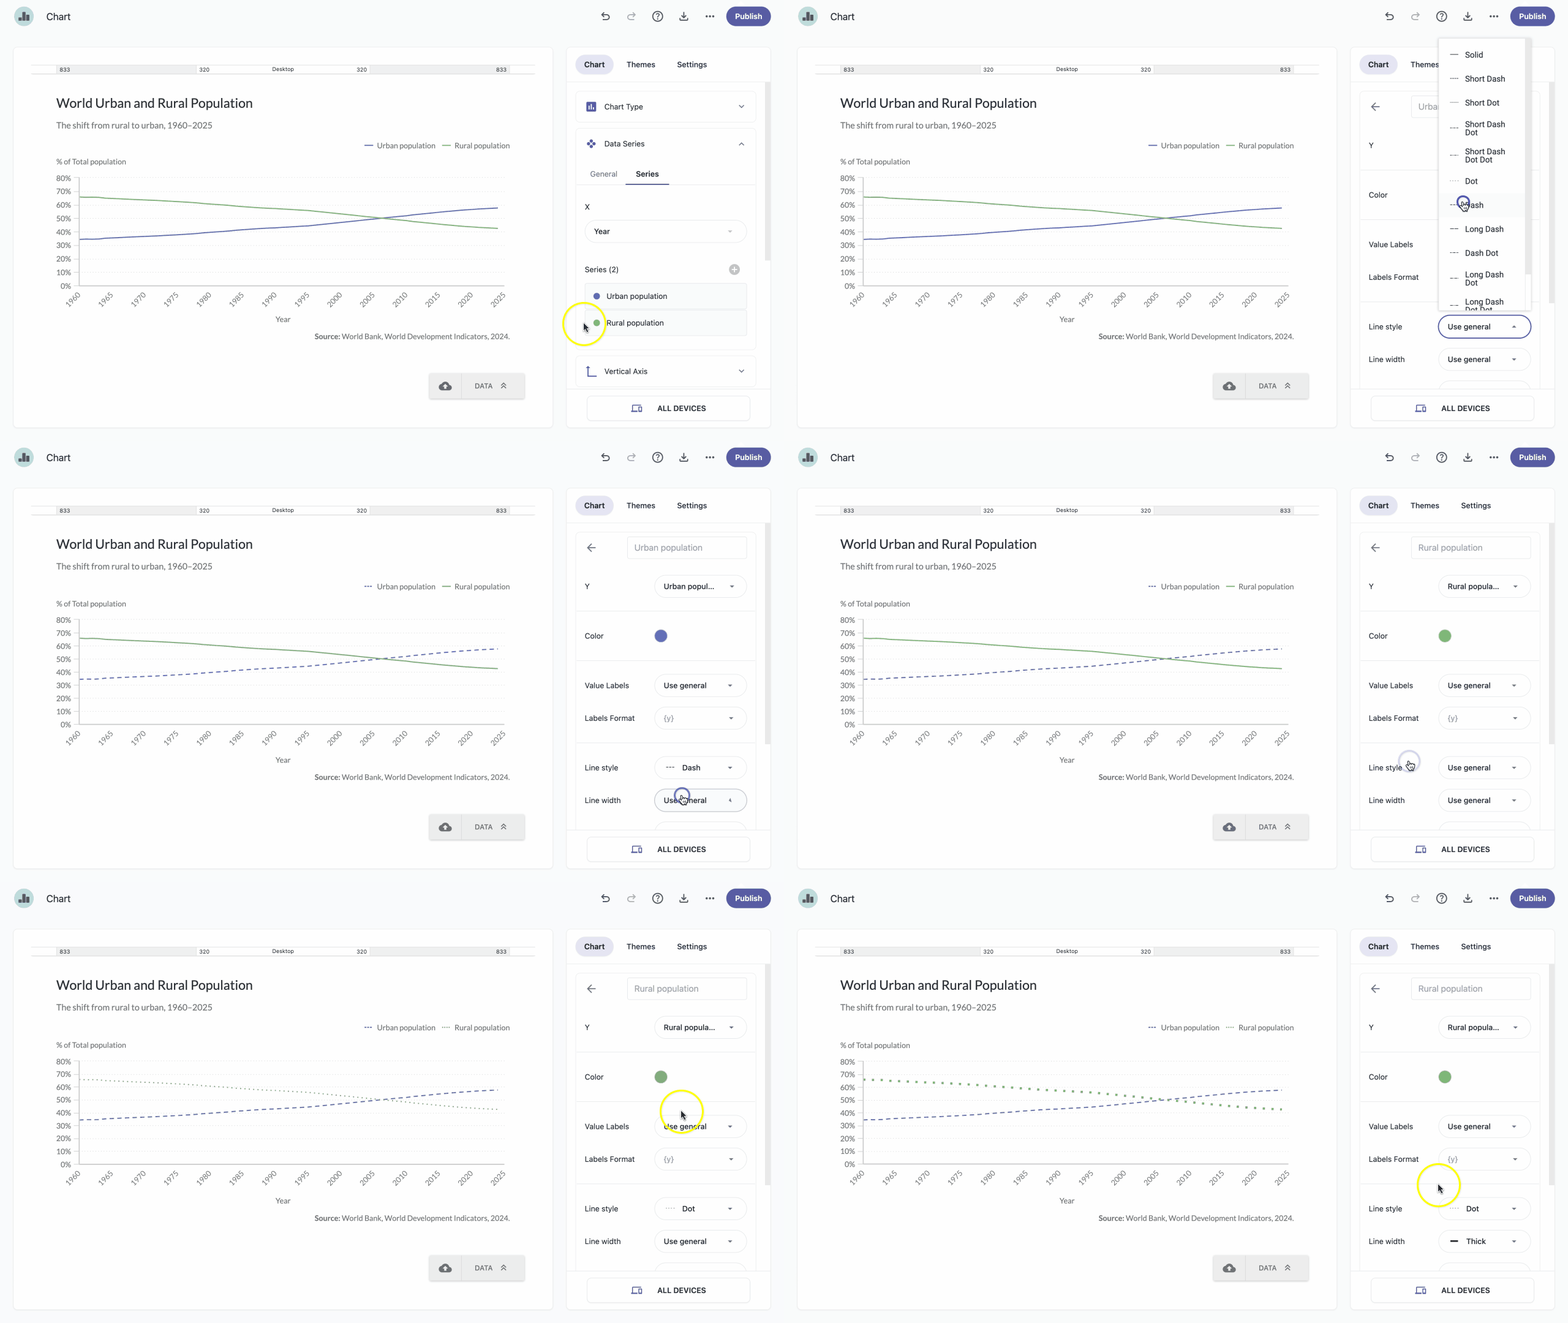
The following chart types support different line styles and line widths to help you show data discontinuity or visualize estimates, or improve accessibility:
- Line
- Spline
- Step
- All Area charts
- Master/Details charts (except Column)
- Scatter Line
- Dual Axis
| Note: Line style and Line width settings in the General section apply to all series, but you can also customize them for each series individually. |
General settings
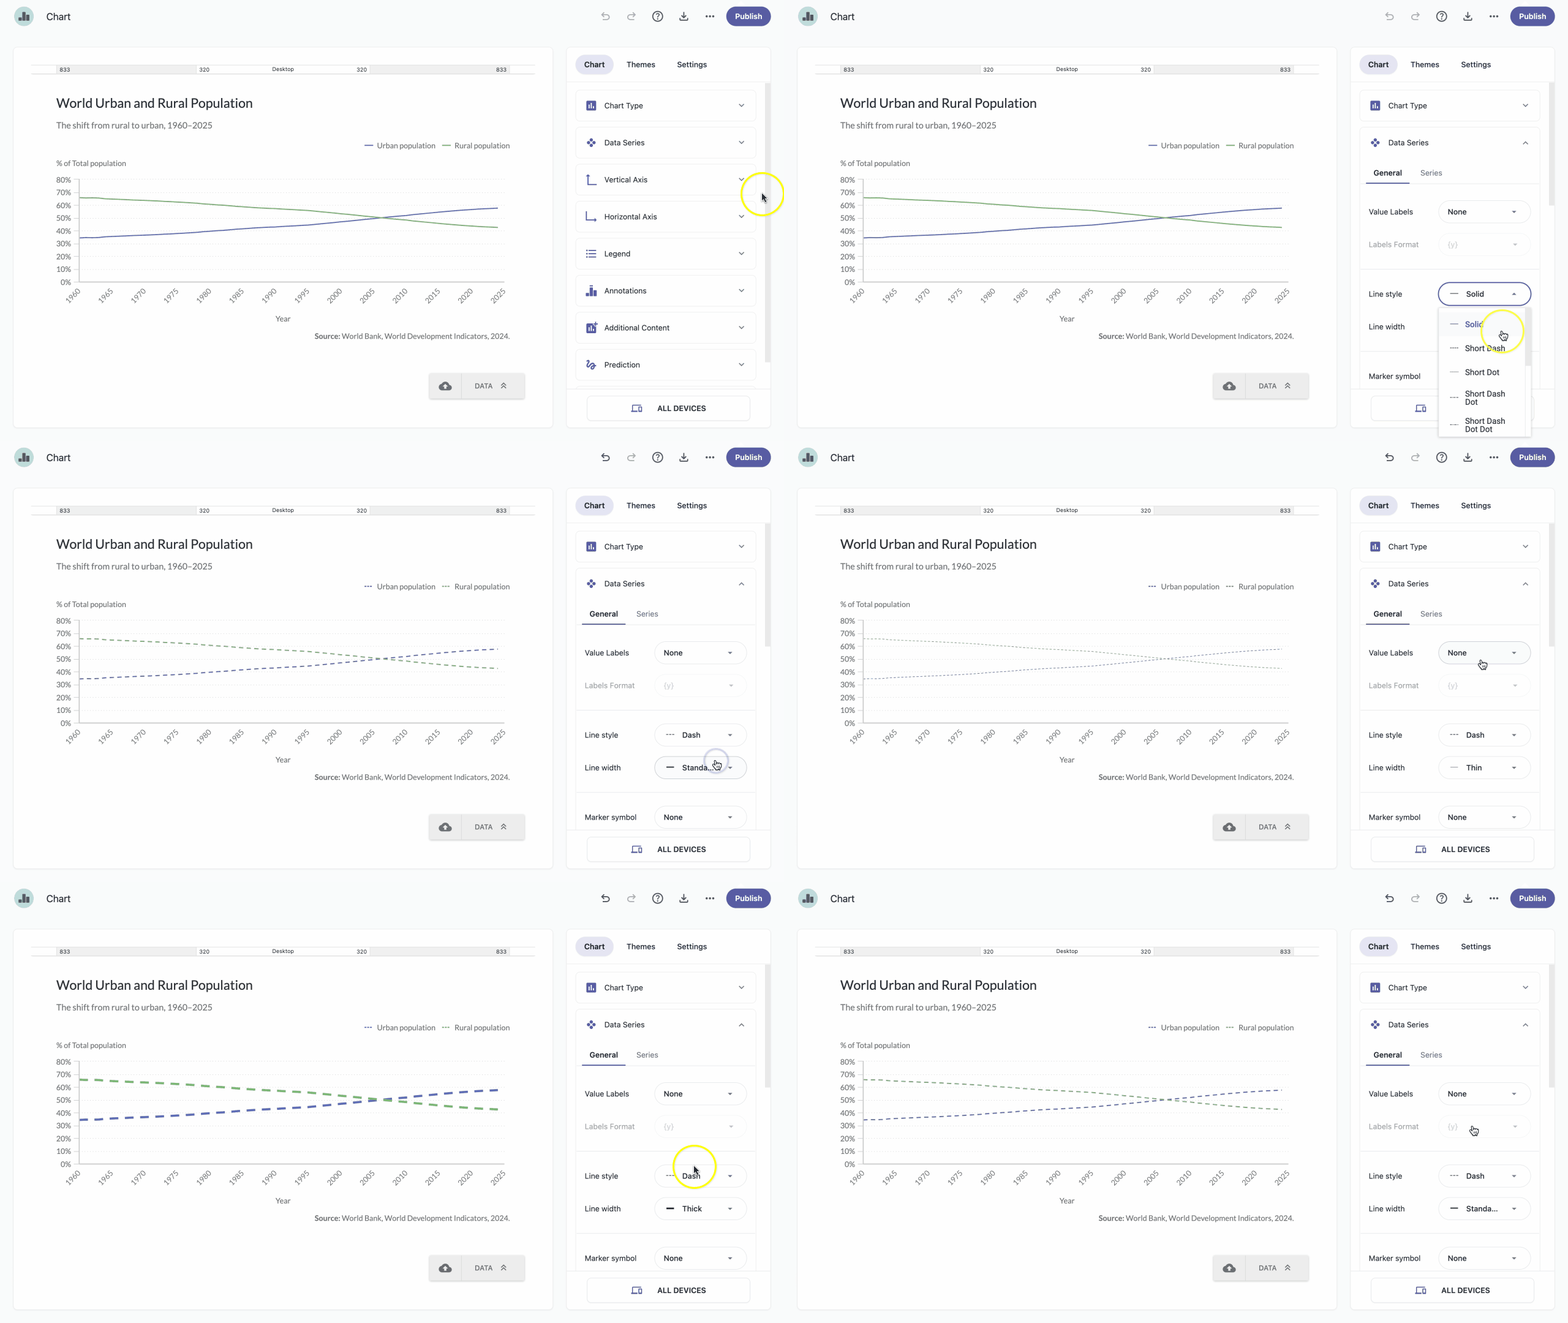
- In the chart panel, click Data Series to open the dropdown menu.
- Open the General tab.
- Next to Line style, click to open the dropdown menu.
- Choose the line style that works best for your chart.
- Next to Line width, click to open the dropdown menu.
- Select the width, and it will be automatically applied to all series.
Individual series settings
- In the chart panel, click Data Series to open the dropdown menu.
- Open the Series tab and click a series to expand it.
- From the Line style dropdown, choose the line style that works best for your chart.
- From the Line width dropdown, choose the line width you want to apply to that specific series.