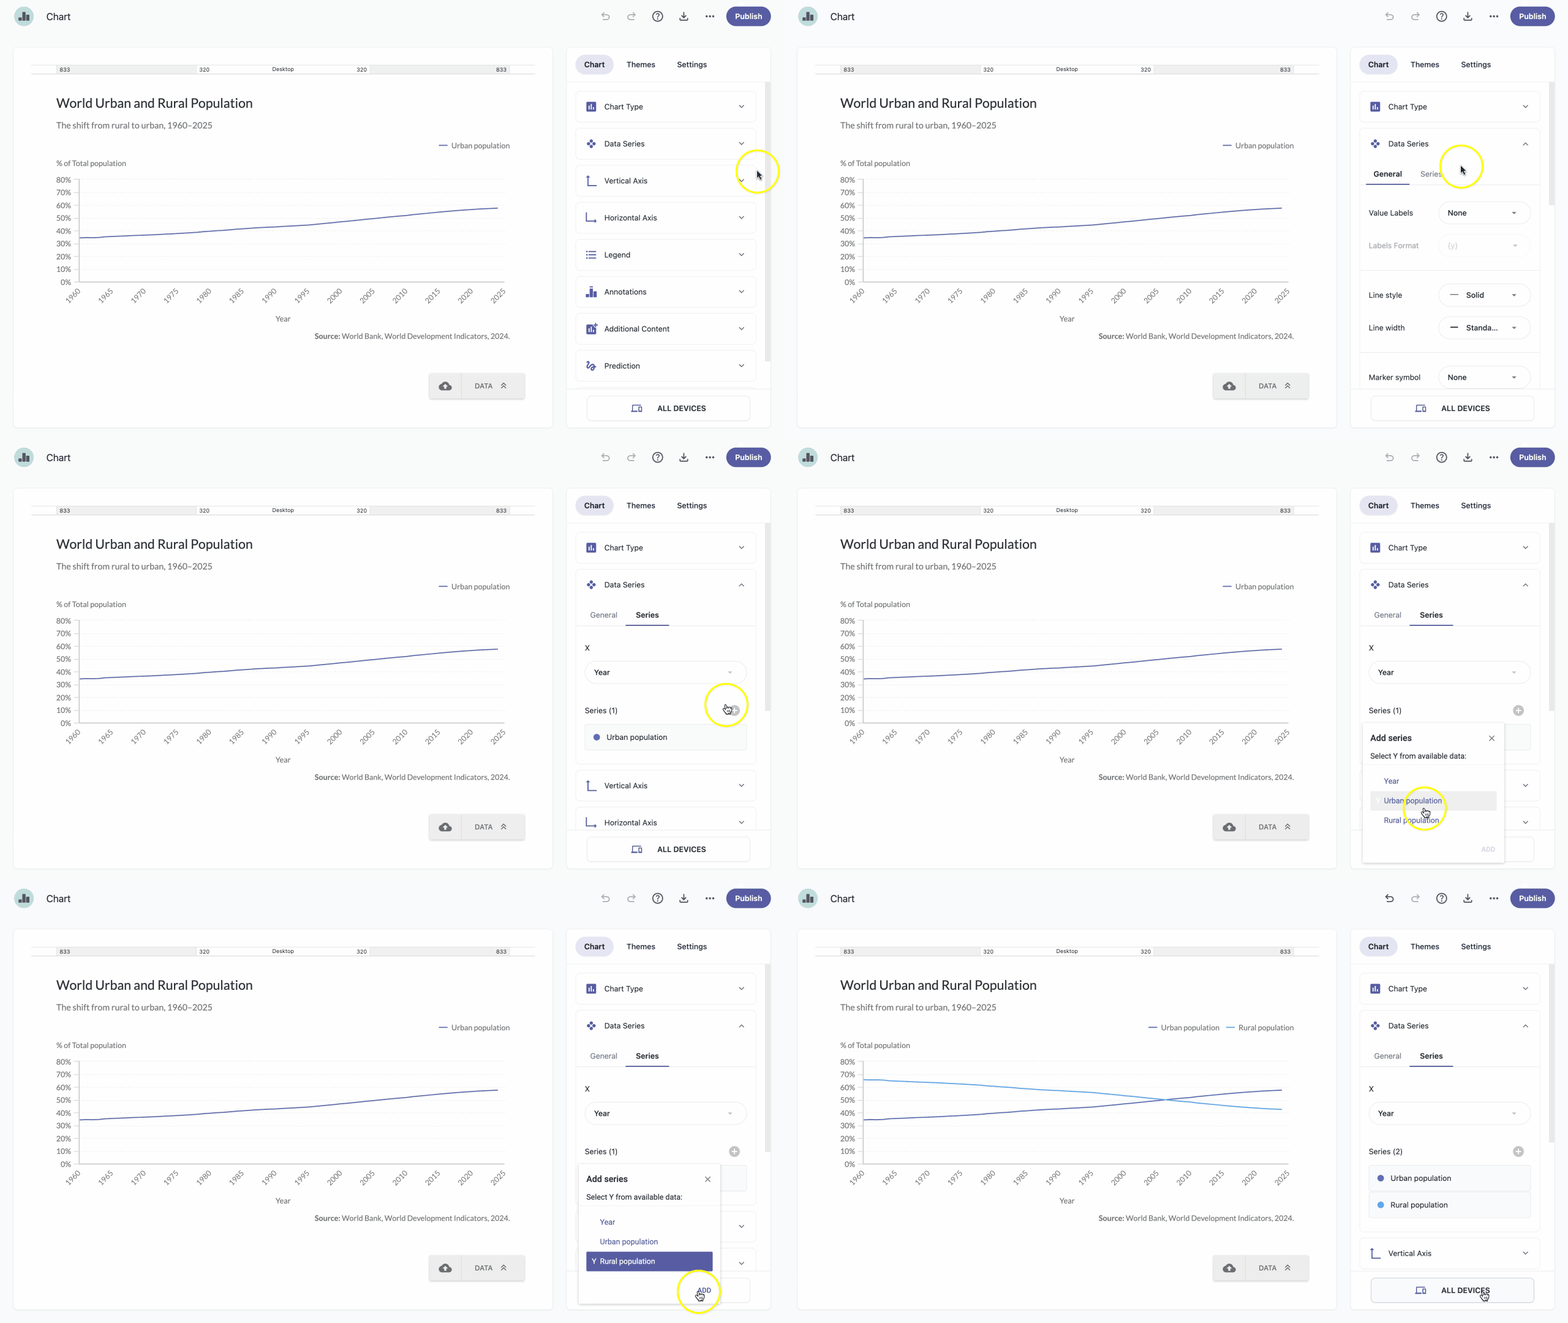
Series are an easy and practical way to select a set of values from your dataset and visualize them on a chart. Each series corresponds to a row or column, depending on the transpose type.
Here's what you need to know about adding a new series.
- In the chart panel, click Data Series to open the dropdown menu.
- In the Series tab, next to the list of series, click the add icon .
- Select the row or column you want to add as a series.
- Click Add.
| Note: You can display one or more data series in a chart using rows or columns, depending on how your data table is structured. |