There are several ways to recreate your chart. You can update the existing CSV, or start over with a new data source:
- Sample data – Use one of the built-in sample datasets to quickly recreate your chart with new example data.
- Upload CSV – Replace your data by uploading a CSV, XLS, or XLSX file from your computer.
- Google Sheets – Recreate your chart using live data from a Google Sheets spreadsheet.
- FRED data – Recreate your chart using economic time series from the Federal Reserve Economic Data database.
- StatCan data – Recreate your chart using data from Statistics Canada.
- Social Explorer data – Recreate your chart using demographic and census data from Social Explorer.
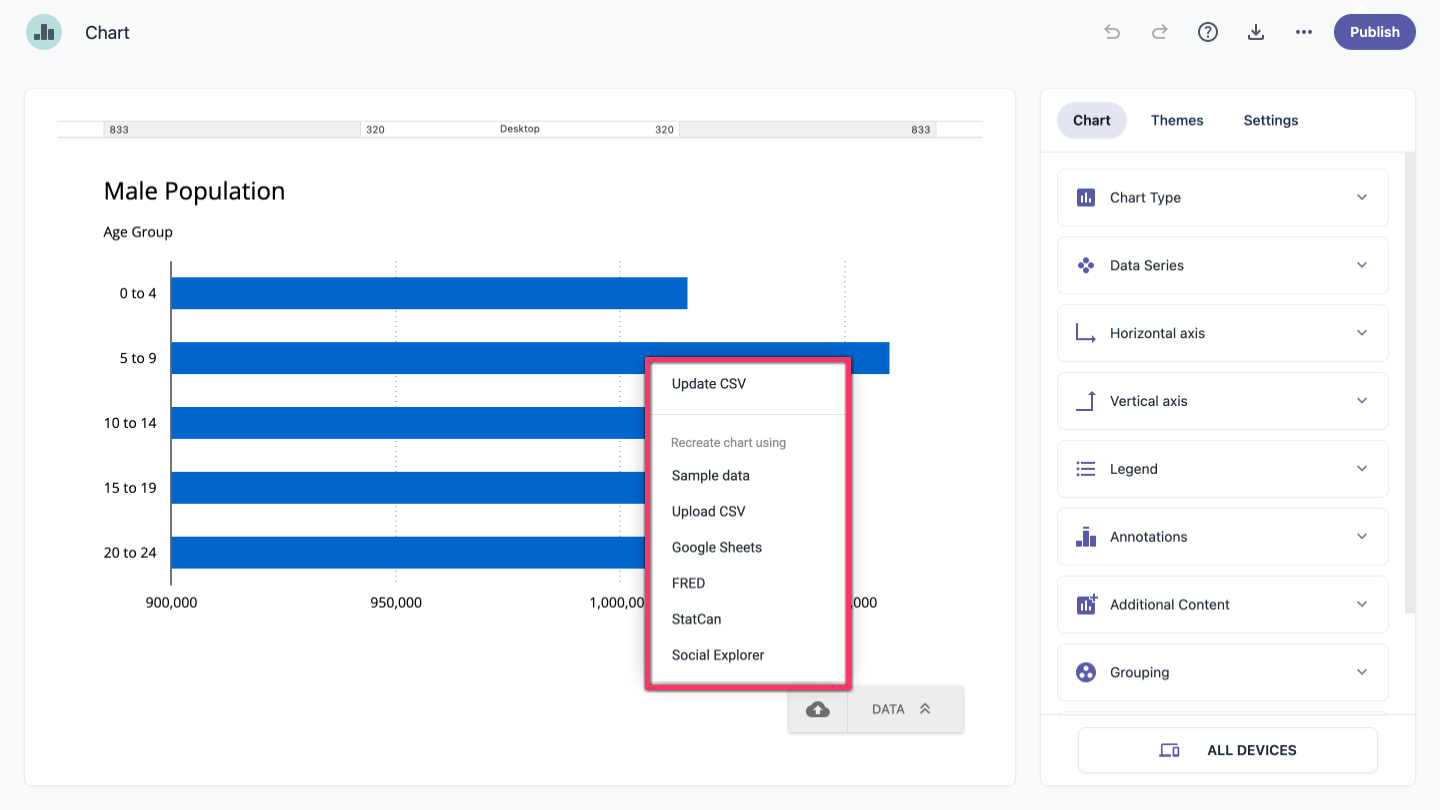
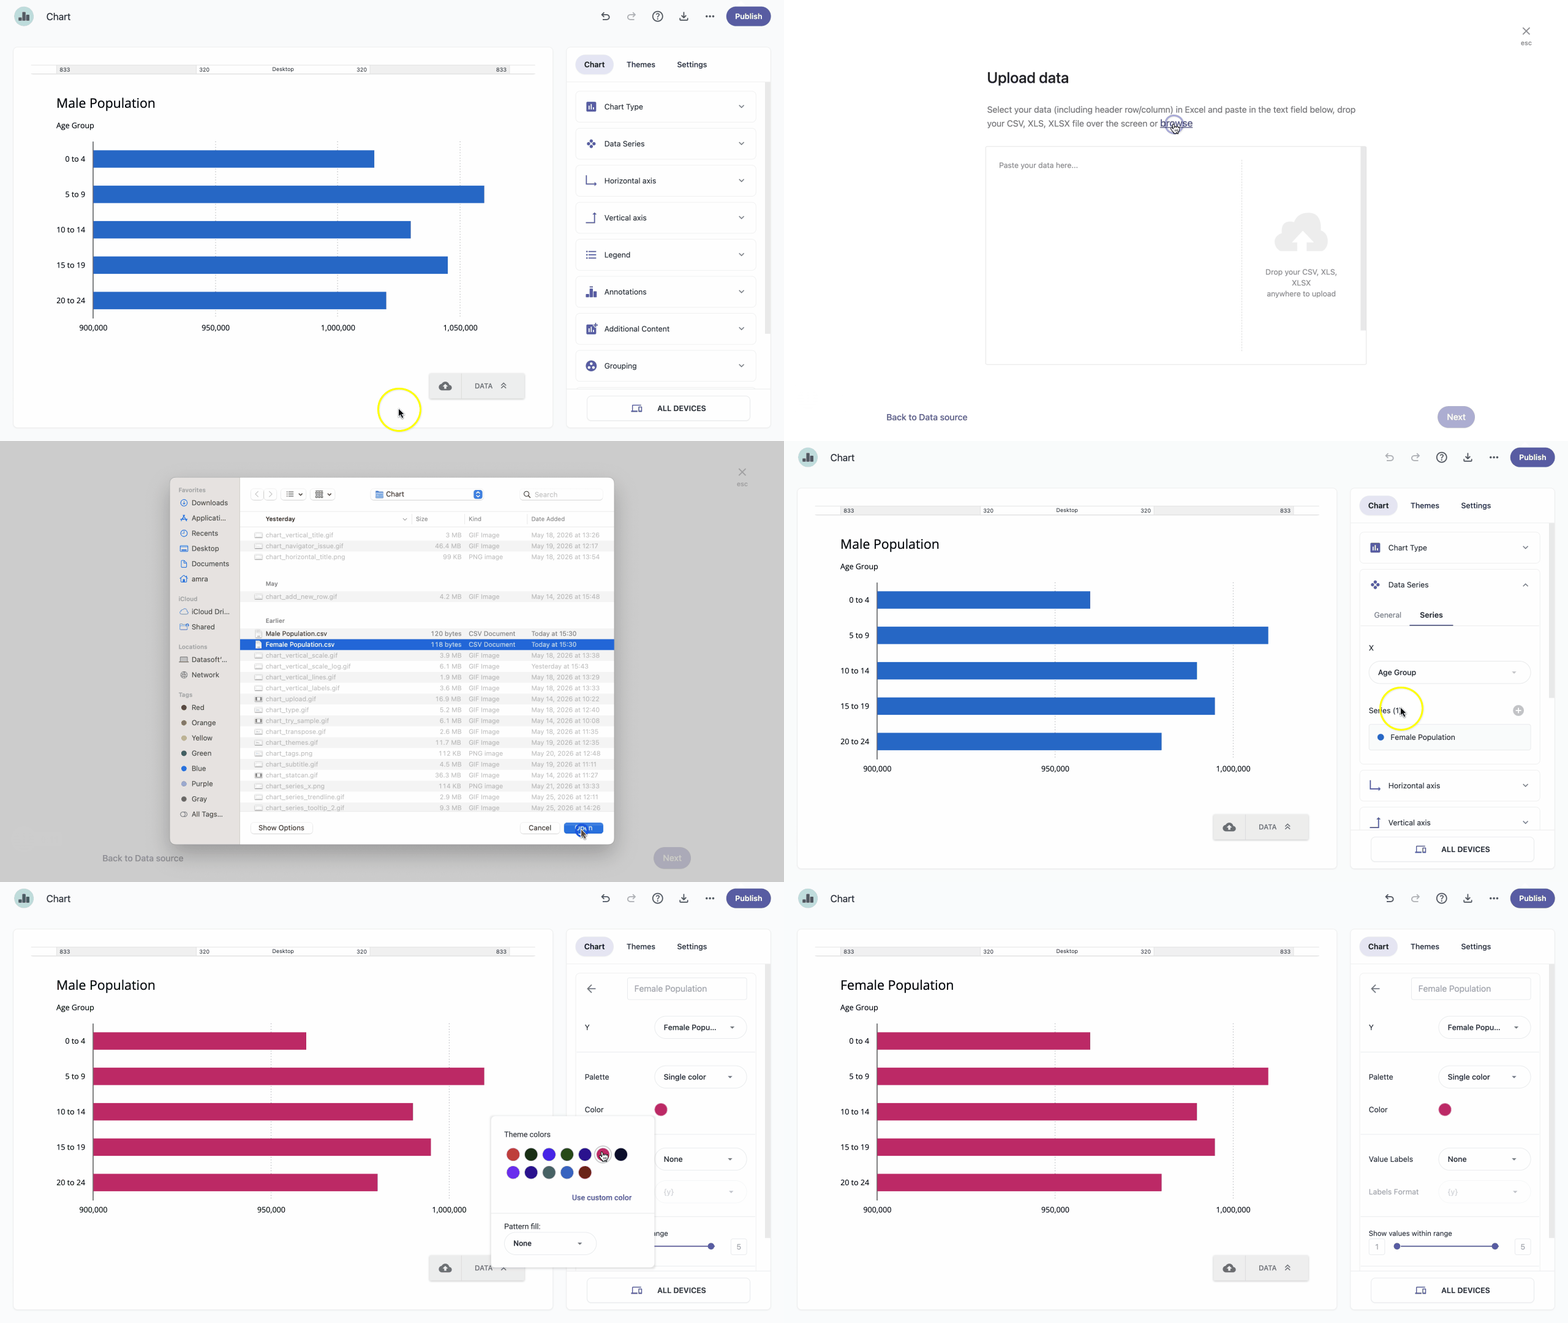
Update CSV
- In the chart panel, click the upload icon .
- Select Update CSV.
-
Click browse to select a file from your computer, paste your data into the Paste your copied data here... field, or drag and drop a file anywhere on the screen.
Note: Supported file formats are CSV, XLS, and XLSX.
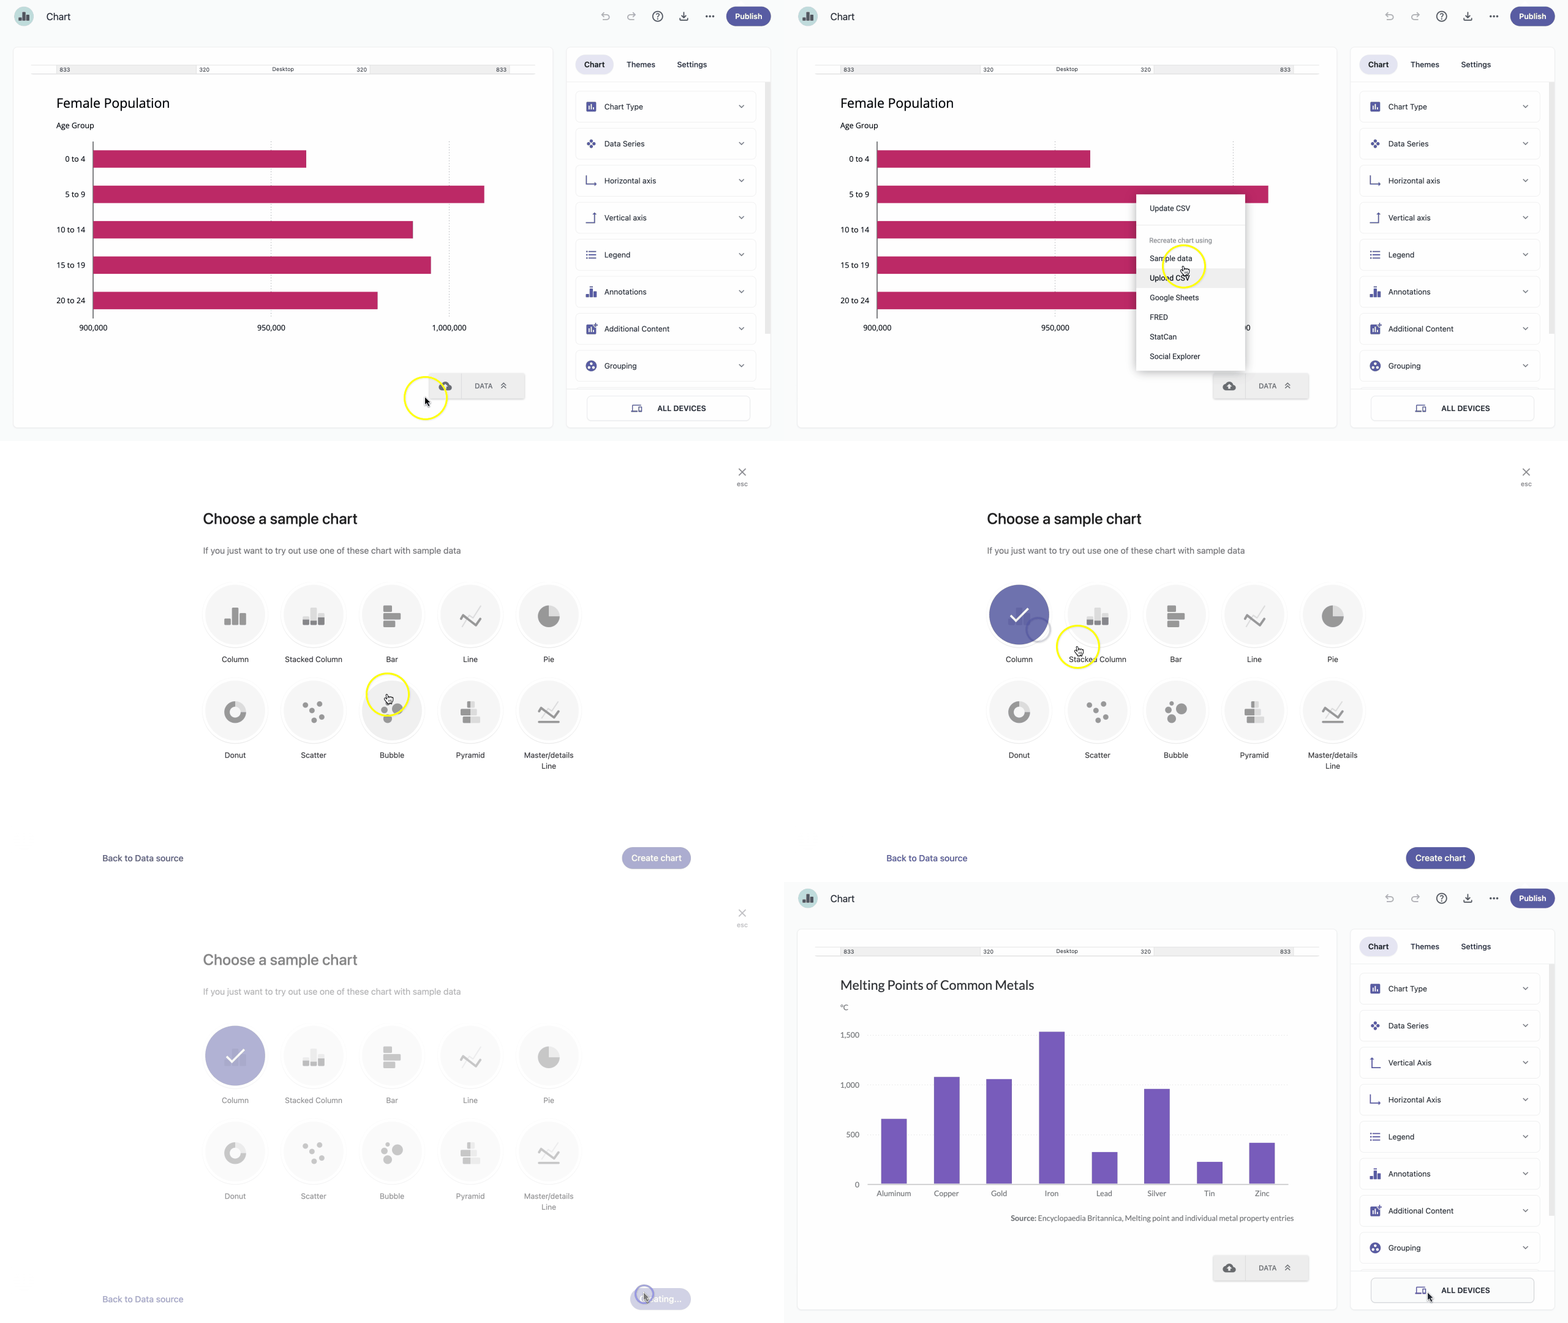
Sample data
- In the chart panel, click the upload icon .
- Select Sample data.
- Choose a sample chart.
- Click Create chart.
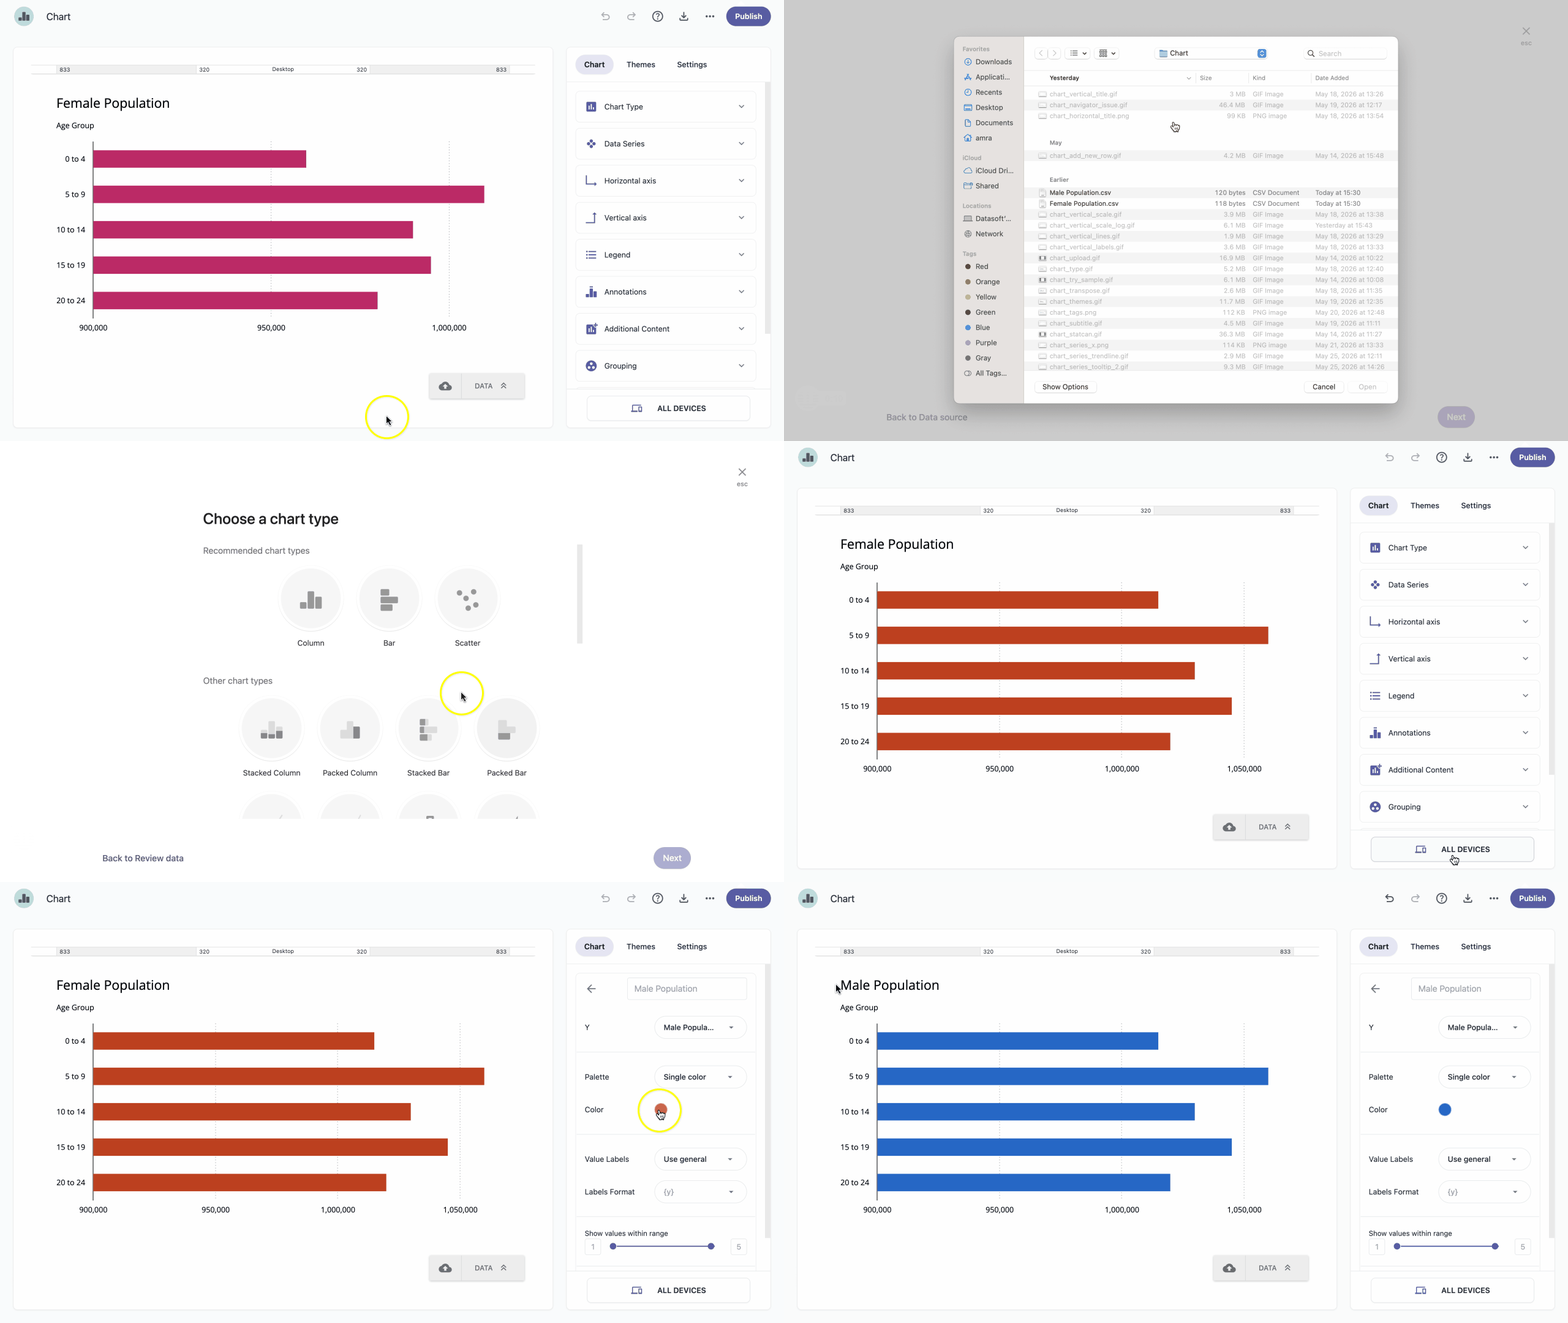
Upload CSV
- In the chart panel, click the upload icon .
- Select Upload CSV.
-
Click browse to select a file from your computer, paste your data into the Paste your copied data here... field, or drag and drop a file anywhere on the screen.
Note: Supported file formats are CSV, XLS, and XLSX. -
After reviewing your data in the review window, click the Next button.
Note: At this point, you can change the data type if needed, or transpose the data. To learn more, see Editing columns and Transpose data in the Working with data section. - Choose the chart type that works best with your data and click Next.
-
In the Preview window, review your chart and click Create Chart.
Note: If the chart doesn't appear as expected, you can try transposing the data. To learn more, see Transpose data.
To learn more about the other data source options, see: