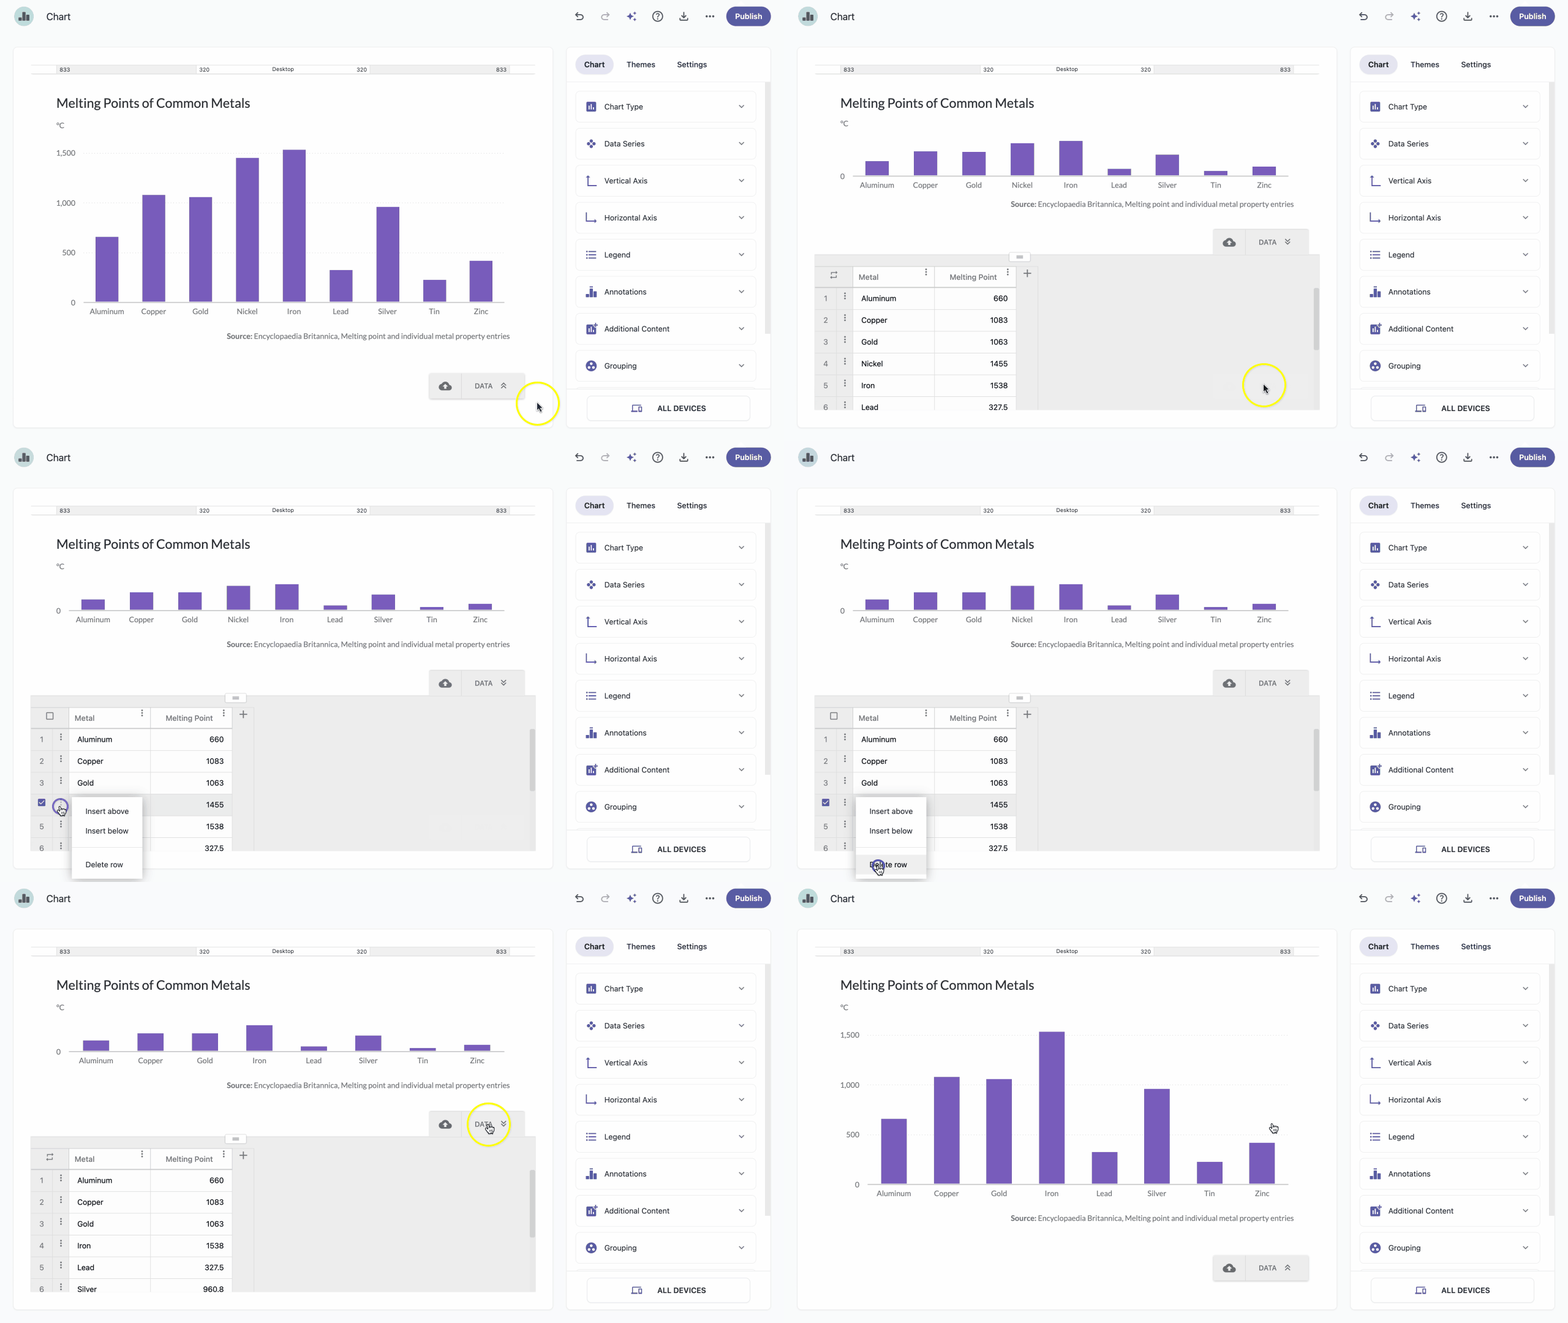
All your data is organized in a grid of columns and rows. You can customize existing data, as well as add or delete columns and rows.
| Note: Data for charts with the auto-update option cannot be changed within the data grid. |
| Note: You can drag and drop rows to reorder them. |
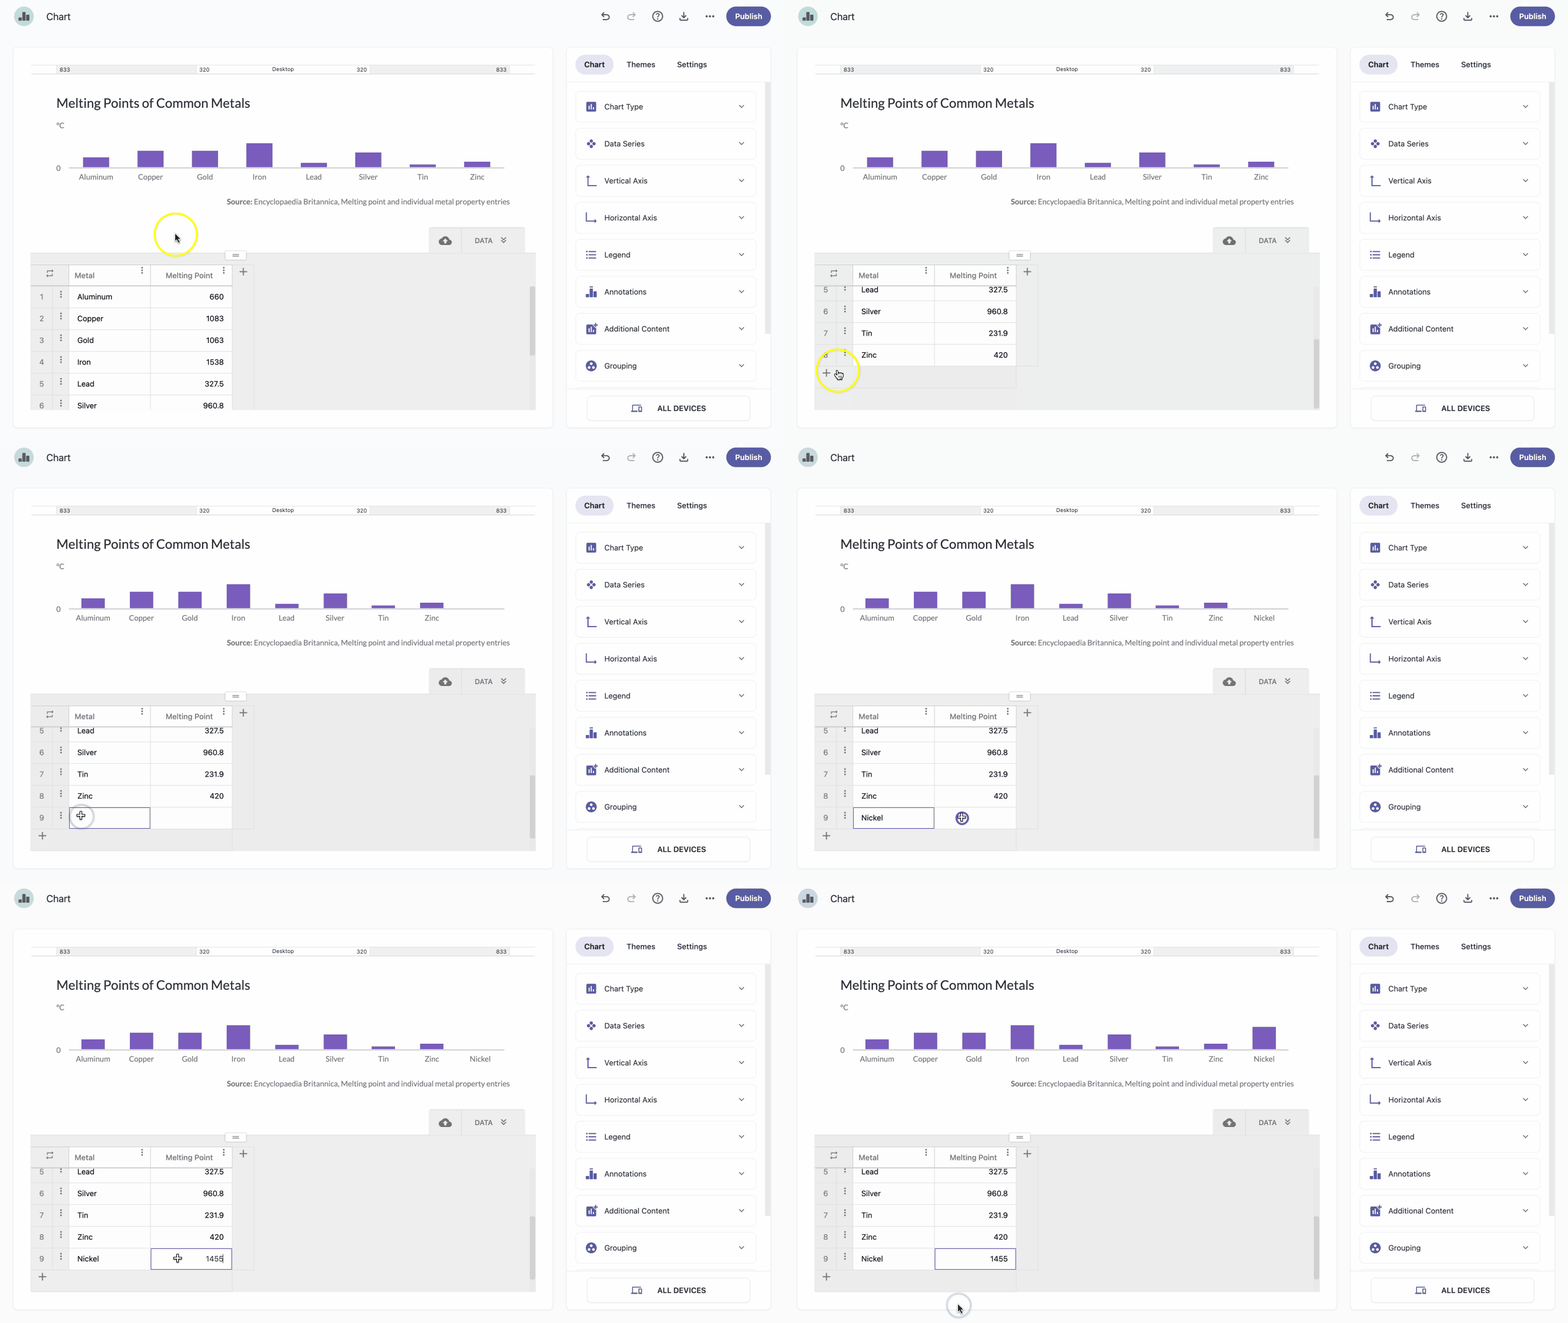
Add row at the end of the grid
- In the chart panel, click DATA in the bottom-right corner to open the data grid.
- Below the last row, click the add row icon to add a new row.
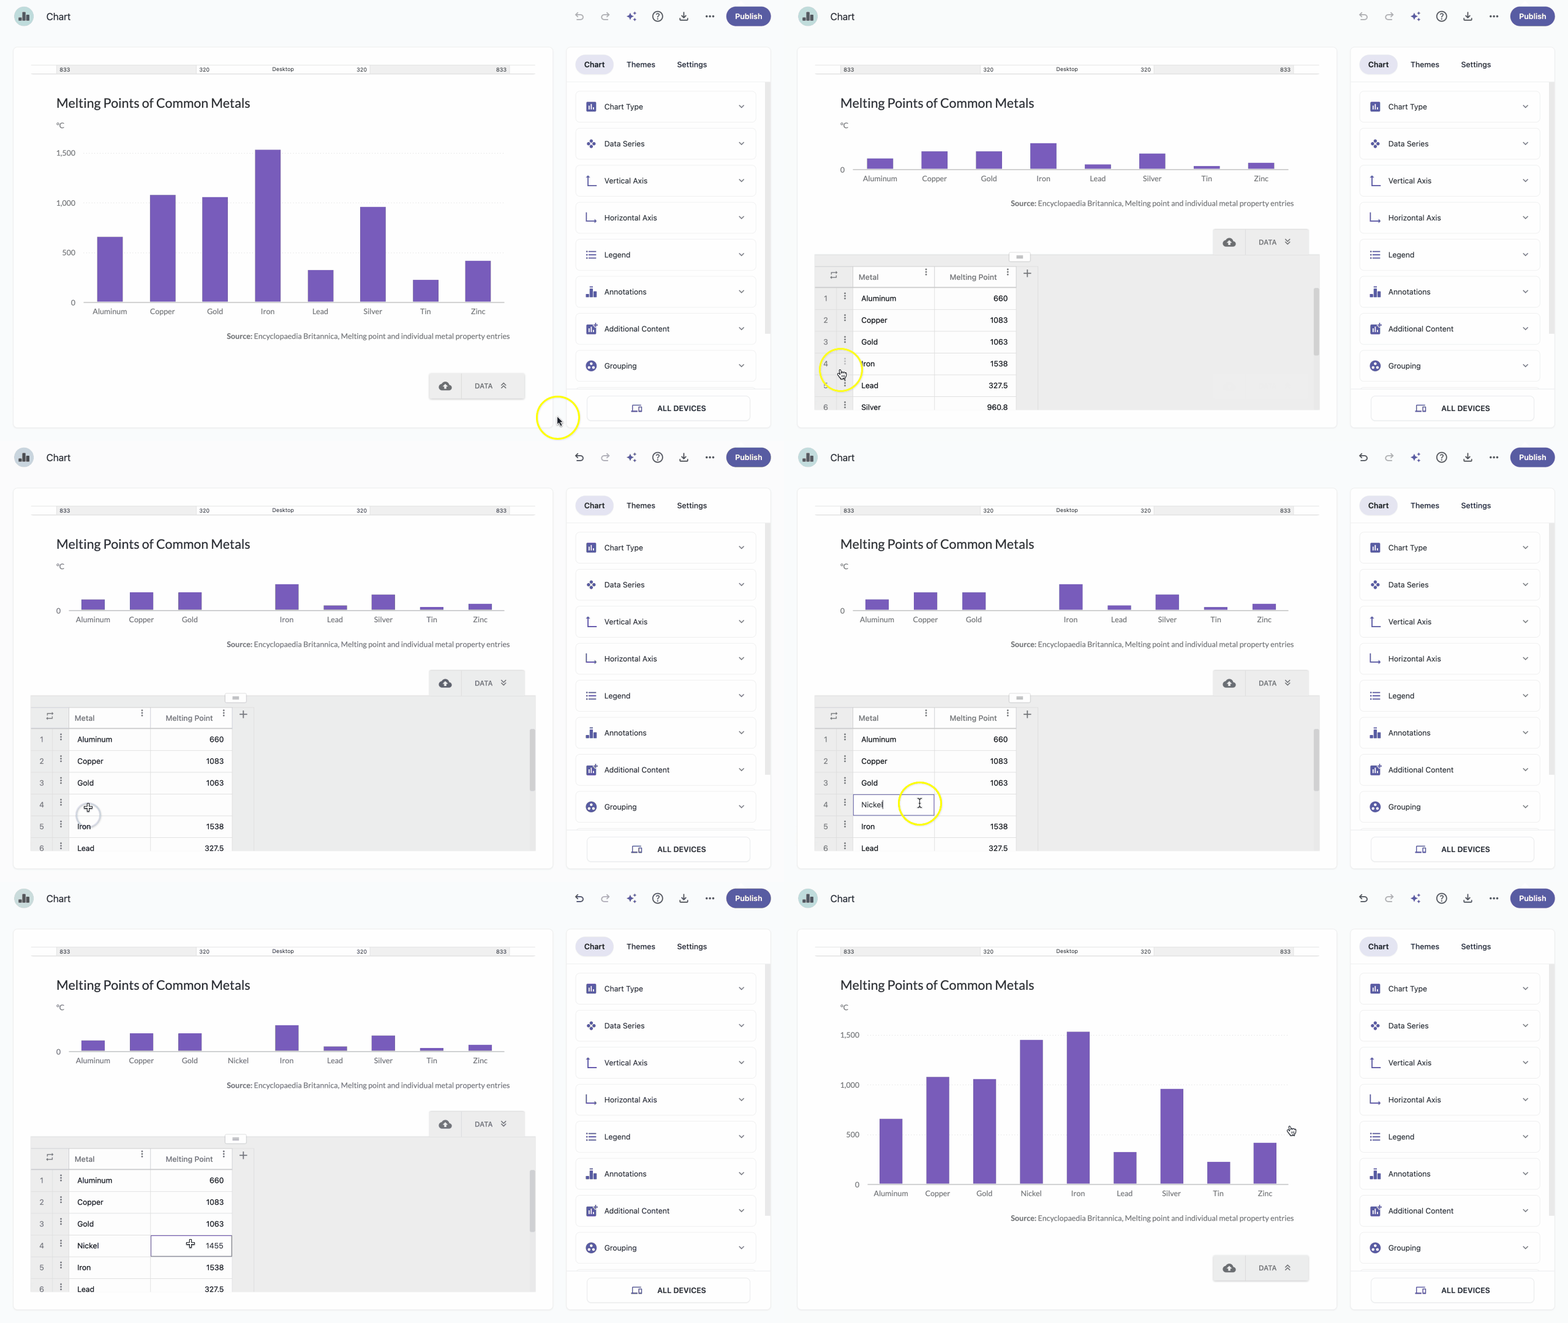
Add row between existing rows
- In the chart panel, click DATA in the bottom-right corner to open the data grid.
- Click the more icon next to the row number.
- Click Insert above or Insert below to add a new row.
Delete row
- In the chart panel, click DATA in the bottom-right corner to open the data grid.
Hover over the row number and use the checkboxes to select one or more rows.
Note: To select all rows, click one checkbox, then click the checkbox in the top-left corner of the data grid. - Click the more icon and select Delete row for a single row or Delete selected rows for multiple rows.