Writing a title and introduction isn't always enough to explain a chart to your readers. You can highlight key information directly on the chart using annotations, which guide readers and draw attention to the most important points.
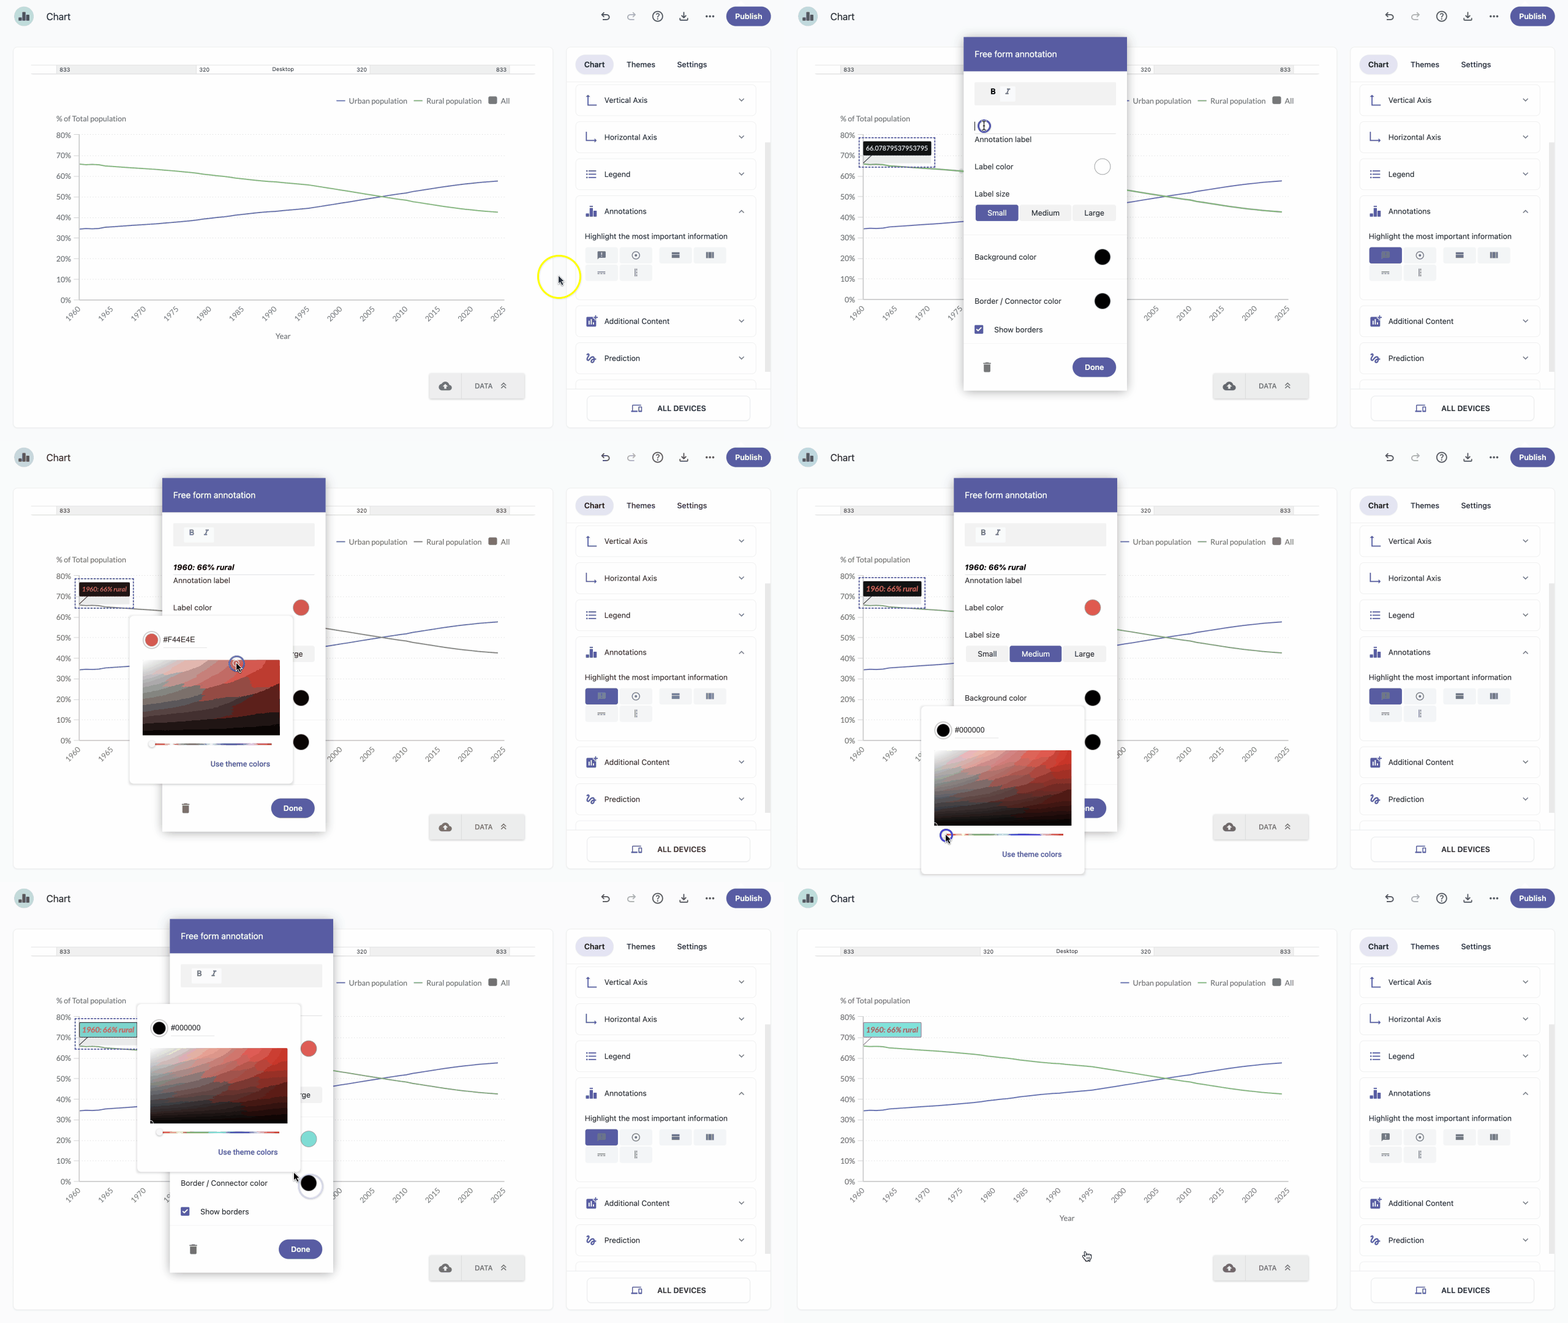
Free form
- In the chart panel, click Annotations to expand it.
- Click Add point annotation .
- Click anywhere on the chart to add the point annotation.
Add an annotation label.
Note: Annotation labels can be formatted using the bold and italic options at the top of the popup window. - Customize the label color and size, background color, and the border and connector lines.
- Click Done.
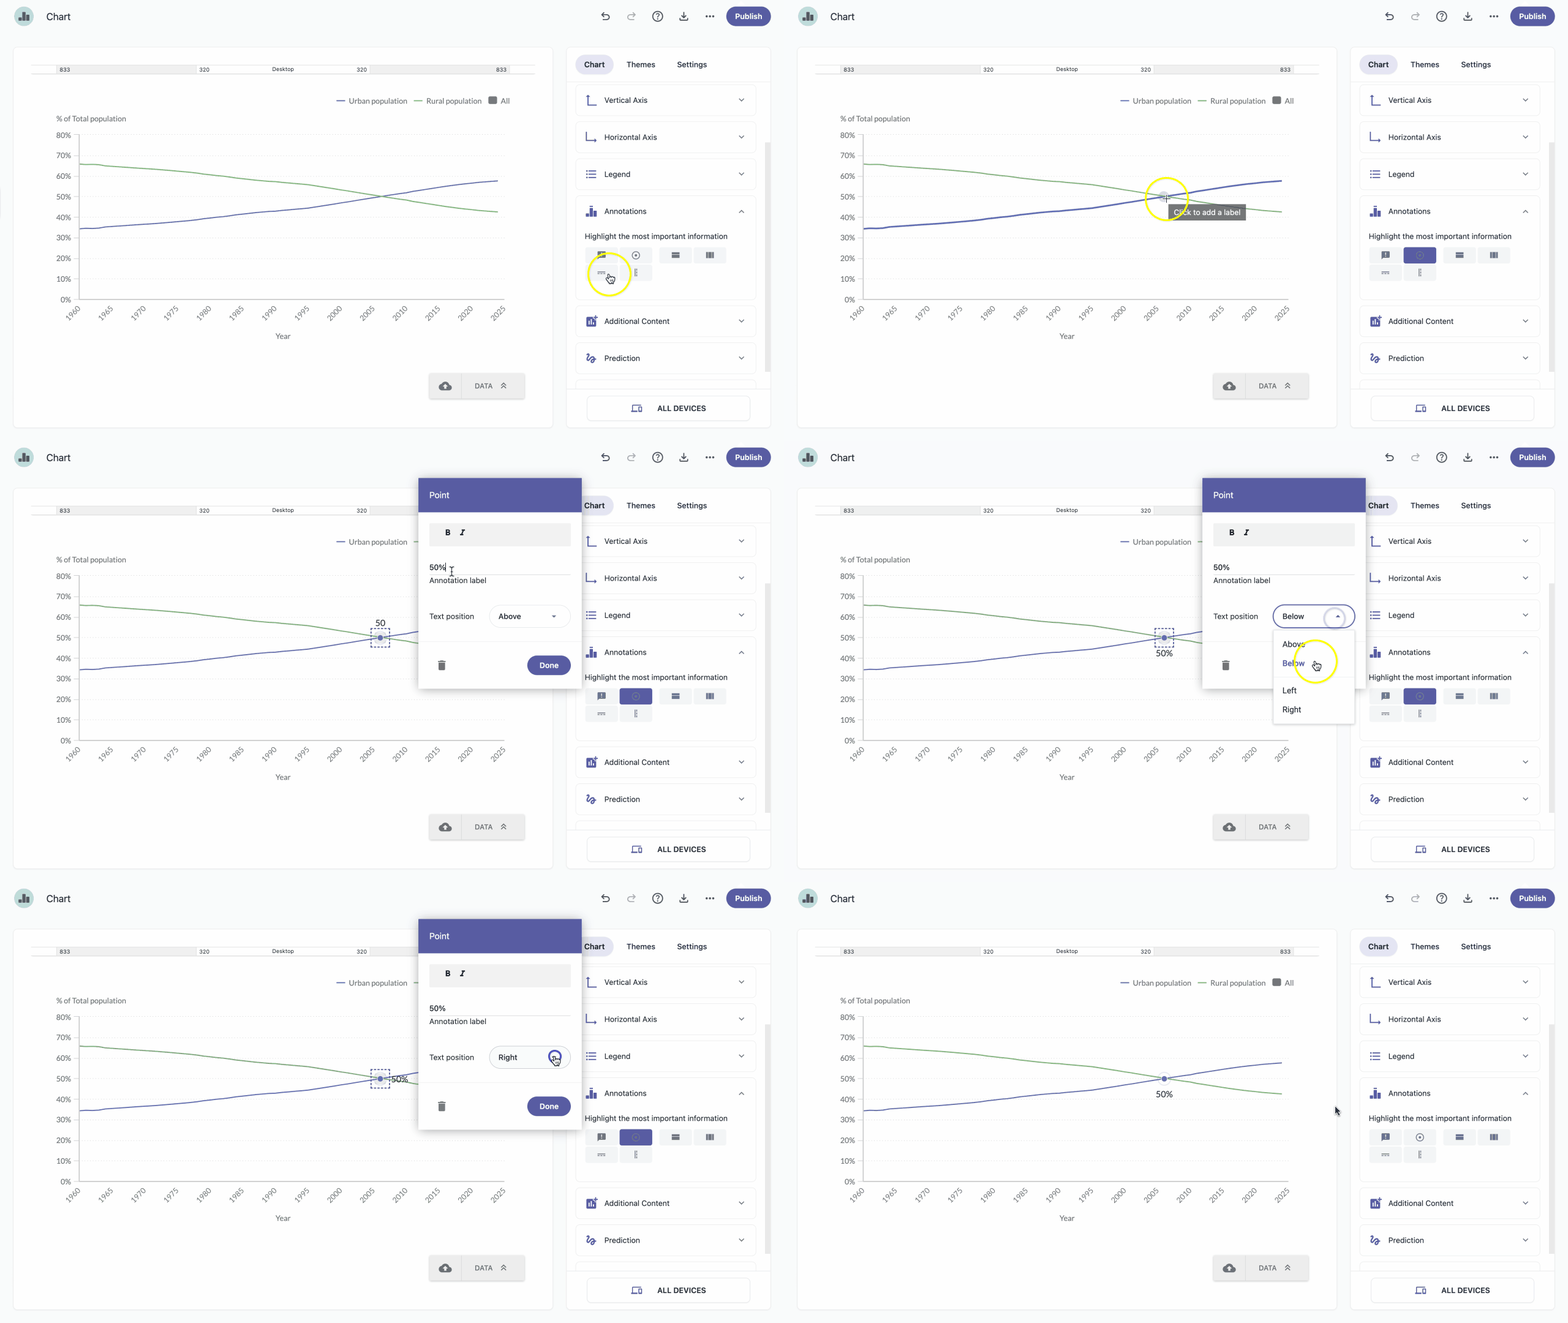
Custom labels
- In the chart panel, click Annotations to expand it.
- Click the Add custom label .
- Hover over the value on the chart and click to add the custom label.
Type in the annotation label.
Note: Annotation labels can be formatted using the bold and italic options at the top of the popup window. - Choose the text position from the dropdown menu.
- Click Done.
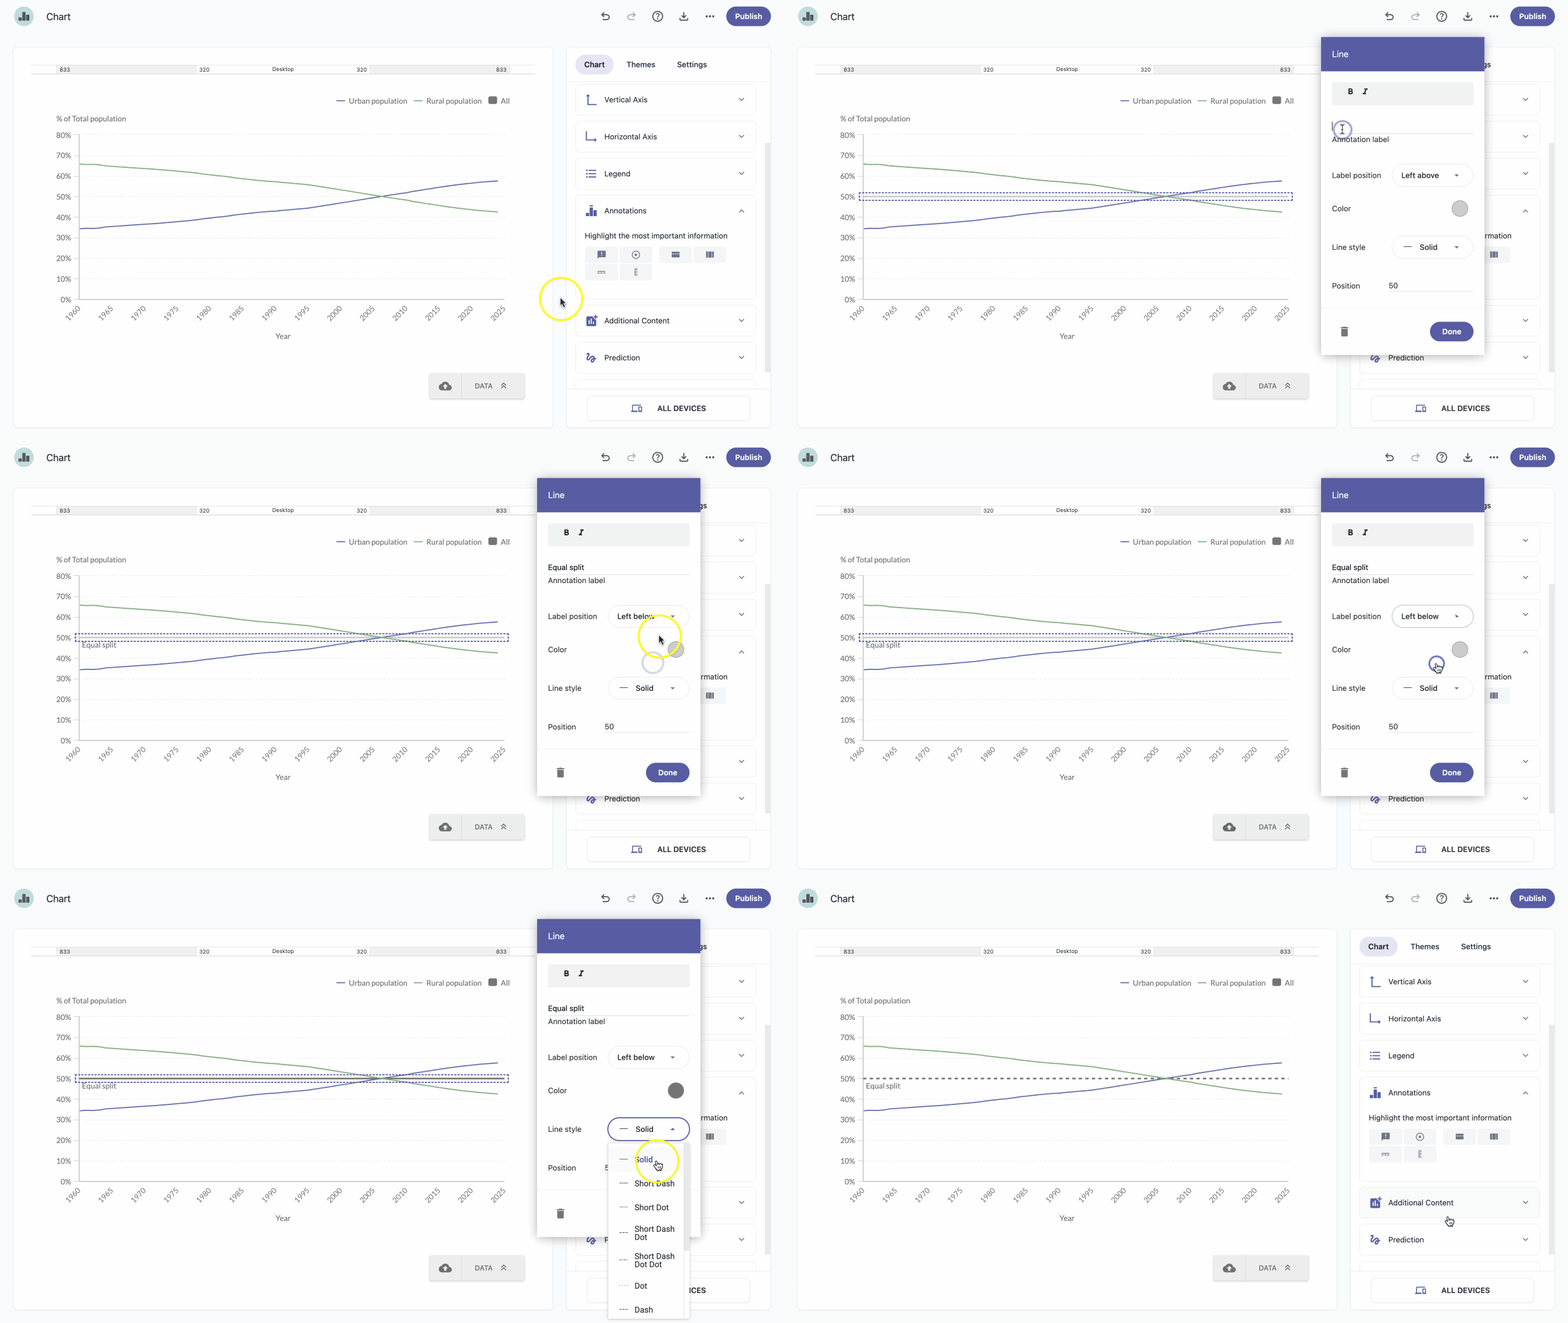
Horizontal line
- In the chart panel, click Annotations to expand it.
- Click Add horizontal line .
- Click on the chart where you want to add the horizontal line.
Type in the annotation label.
Note: Annotation labels can be formatted using the bold and italic options at the top of the popup window. - Choose the label position from the dropdown menu.
- Click the color indicator to change the line color.
- Choose the line style from the dropdown menu.
- Set the line position.
- Click Done.
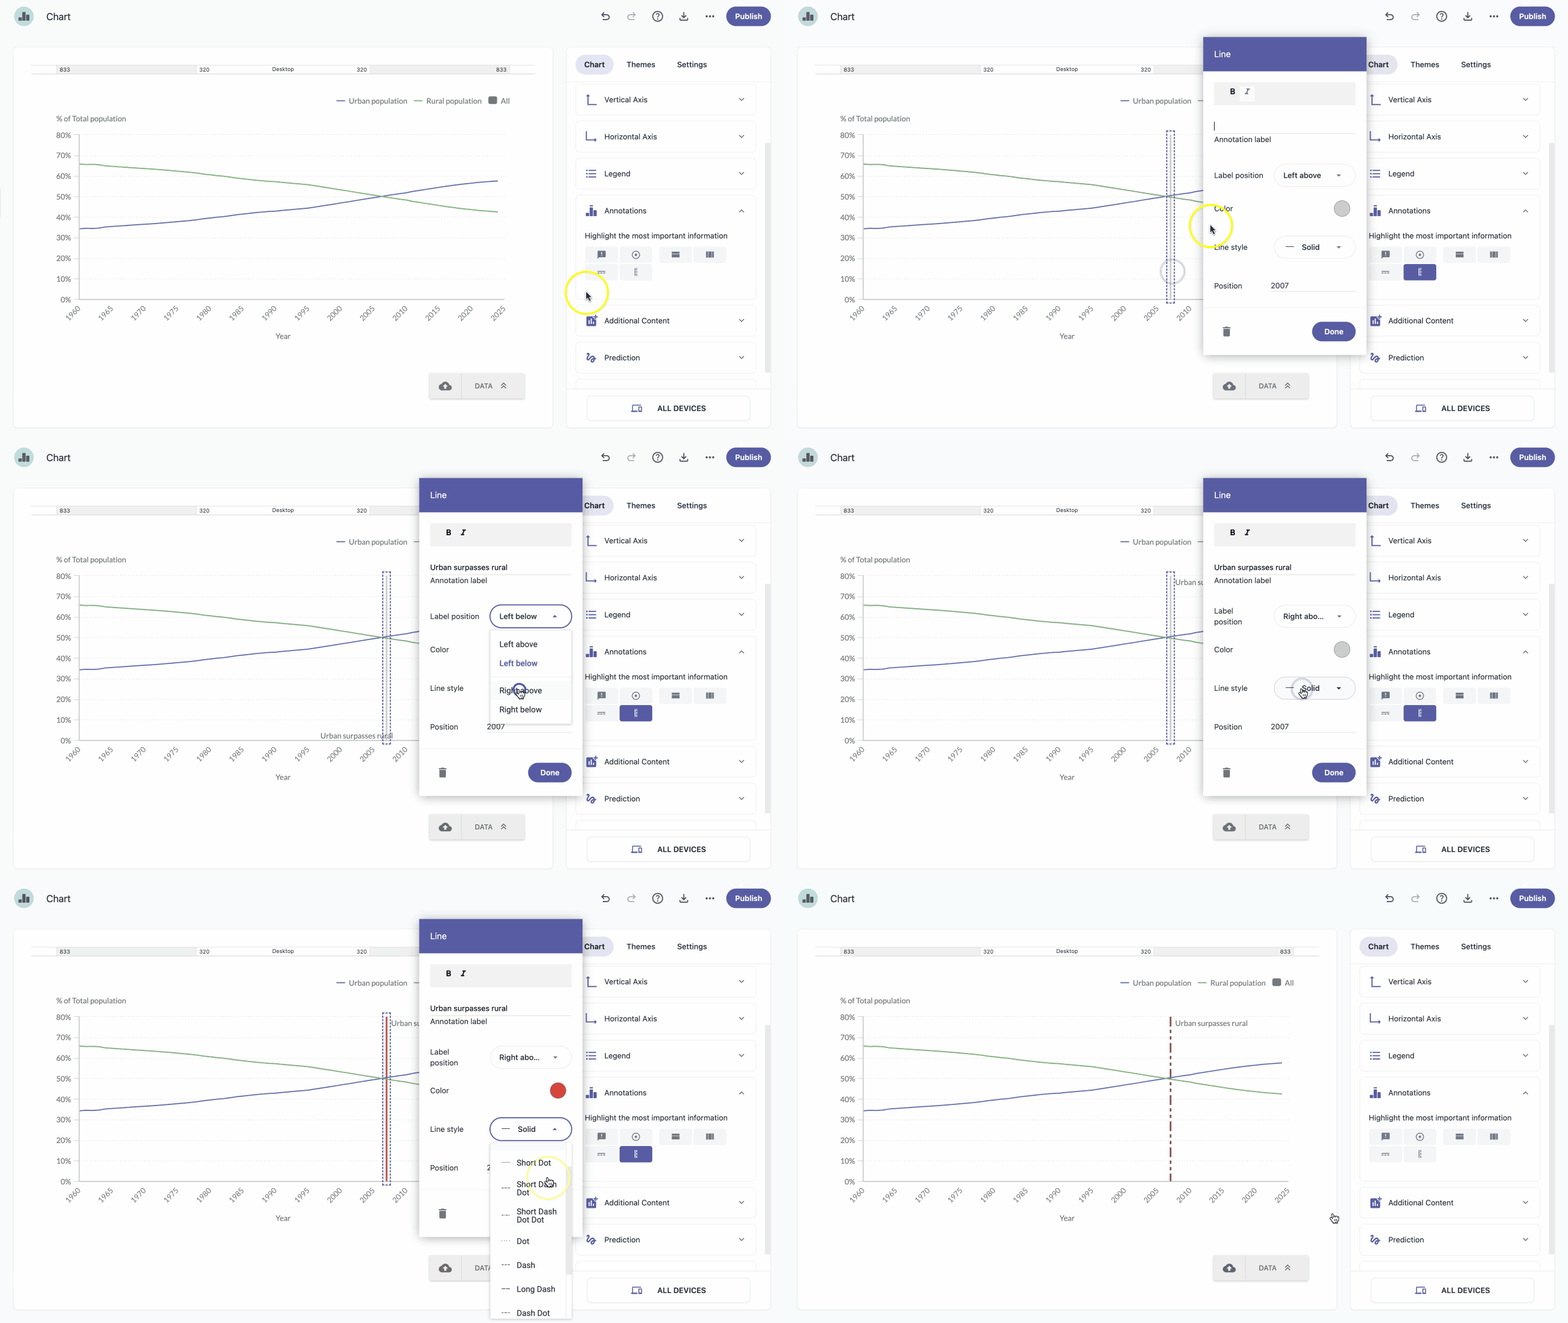
Vertical line
- In the chart panel, click Annotations to expand it.
- Click Add vertical line .
- Click on the chart where you want to add the vertical line.
Type in the annotation label.
Note: Annotation labels can be formatted using the bold and italic options at the top of the popup window. - Choose the label position from the dropdown menu.
- Click the color indicator to change the line color.
- Choose the line style from the dropdown menu.
- Set the line position.
- Click Done.
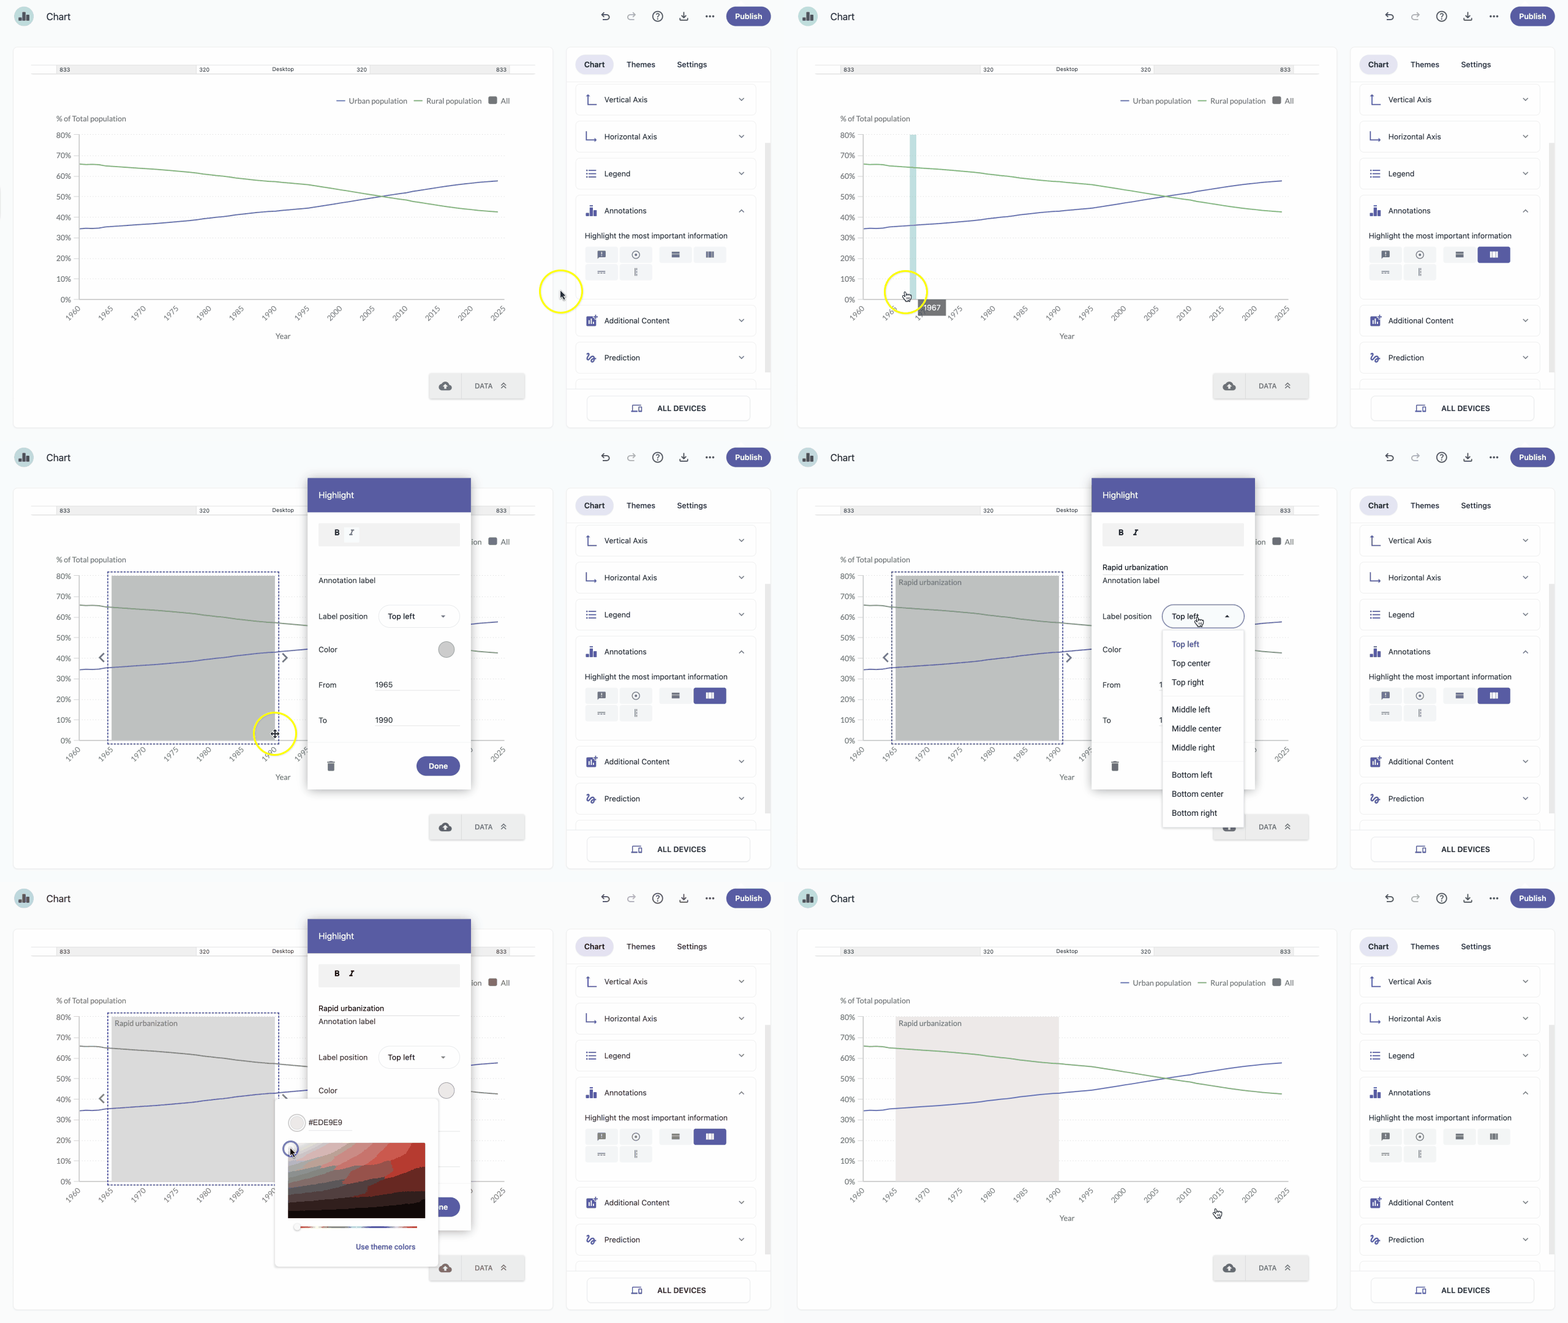
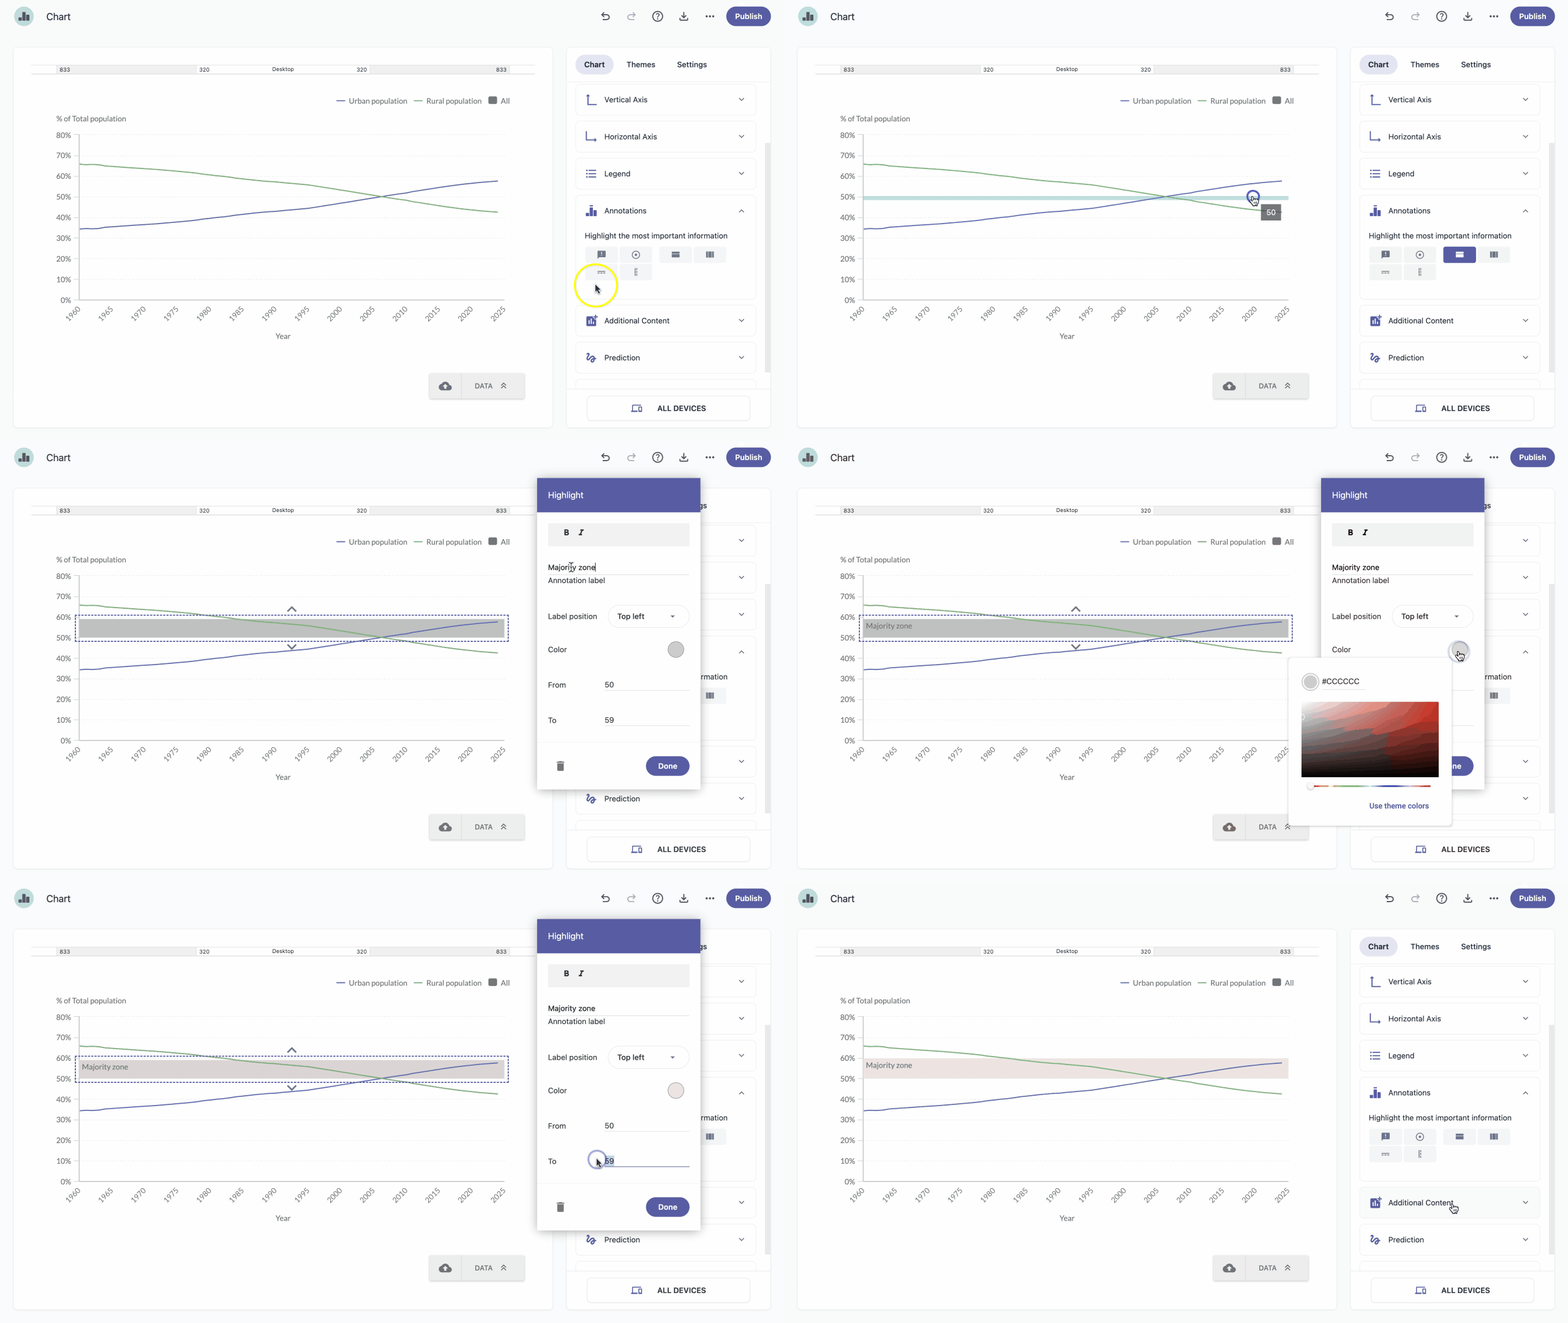
Horizontal range
- In the chart panel, click Annotations to expand it.
- Click Add horizontal range
 .
. - Click and drag on the chart where you want to add horizontal range.
Type in the annotation label.
Note: Annotation labels can be formatted using the bold and italic options at the top of the popup window. - Choose the label position from the dropdown menu.
- Click the color indicator to change the line color.
- (Optional) Set the From – To range to adjust the range.
- Click Done.
Vertical range
- In the chart panel, click Annotations to expand it.
- Click Add vertical range
 .
. - Click and drag on the chart where you want to add vertical range.
Type in the annotation label.
Note: Annotation labels can be formatted using the bold and italic options at the top of the popup window. - Choose the label position from the dropdown menu.
- Click the color indicator to change the line color.
- (Optional) Set the From – To range to adjust the range.
- Click Done.