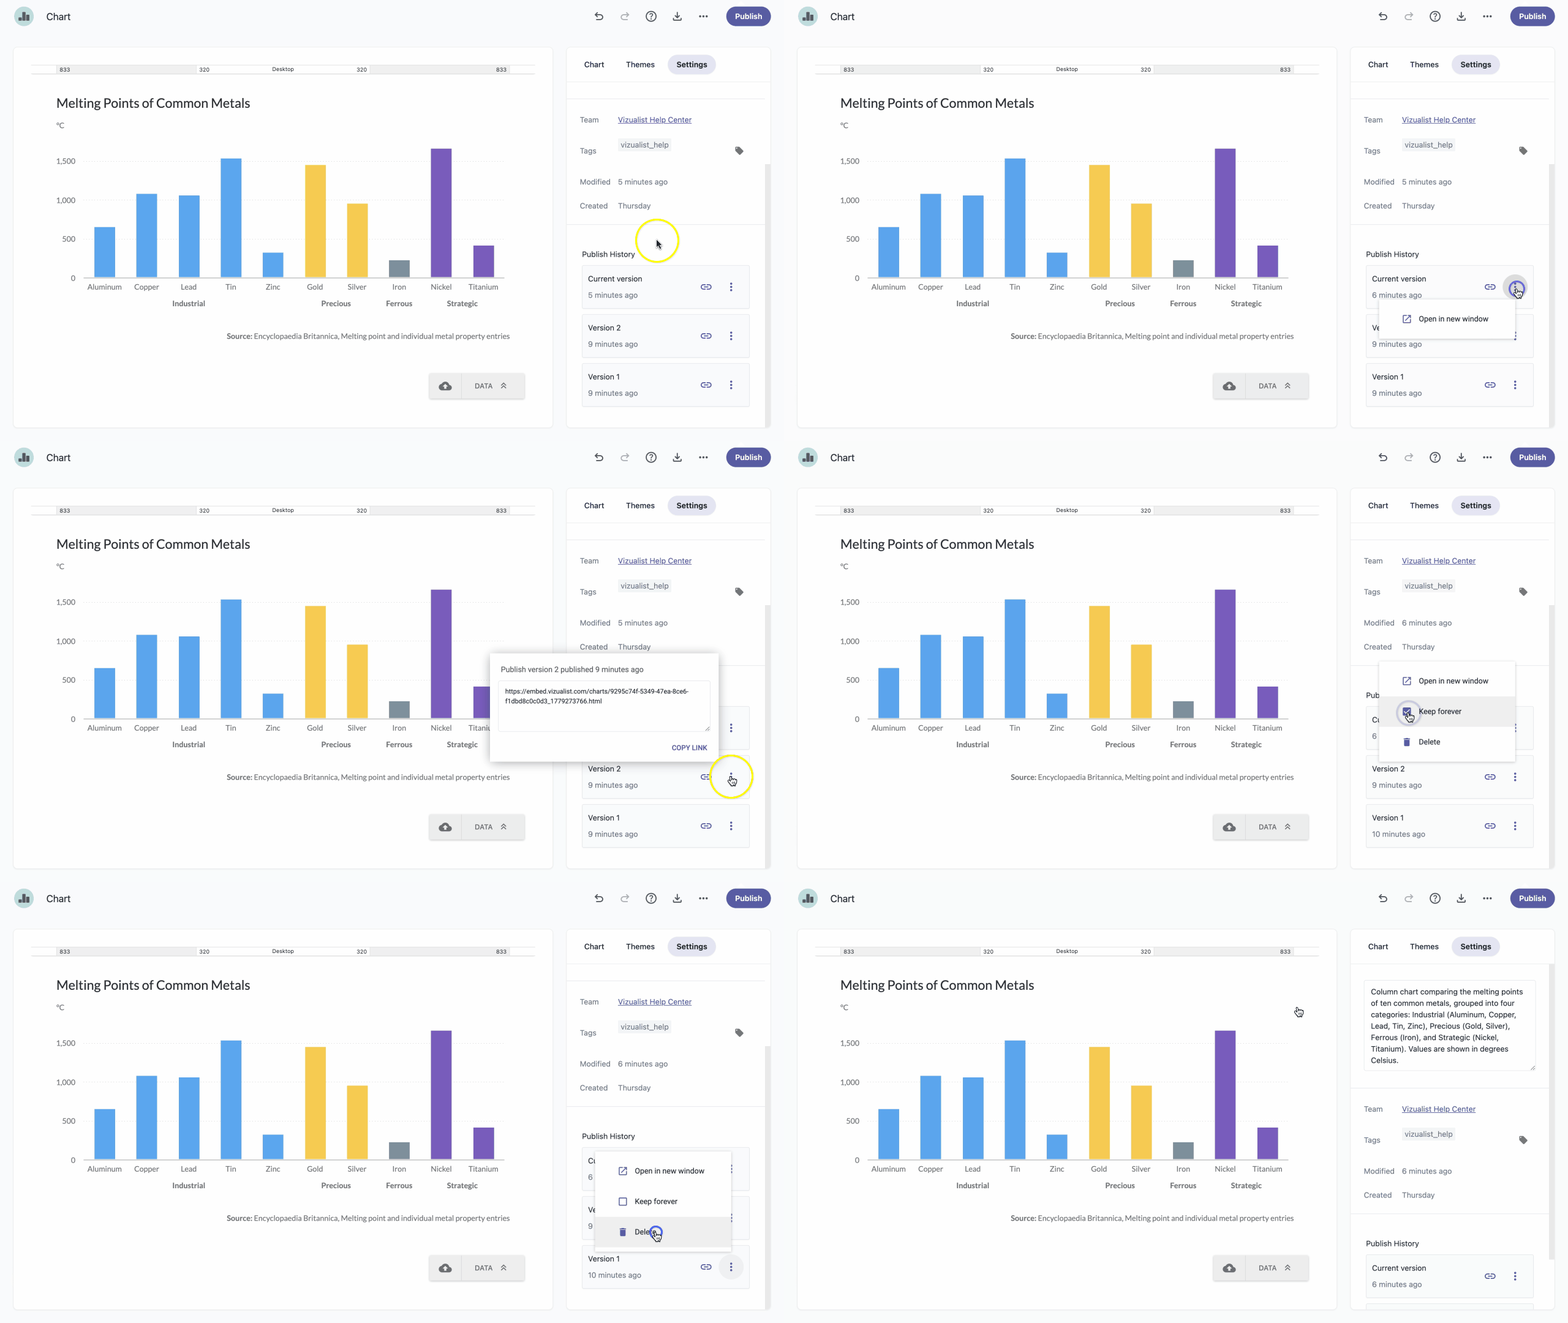
Once you've finished working on a chart, there's one more thing to do before publishing and sharing it — sorting out the metadata. Metadata is all the information about the chart itself, rather than the data inside it. It includes the information about the project the chart belongs to, its tags, when it was created, when it was last modified, and its publish history.
Description
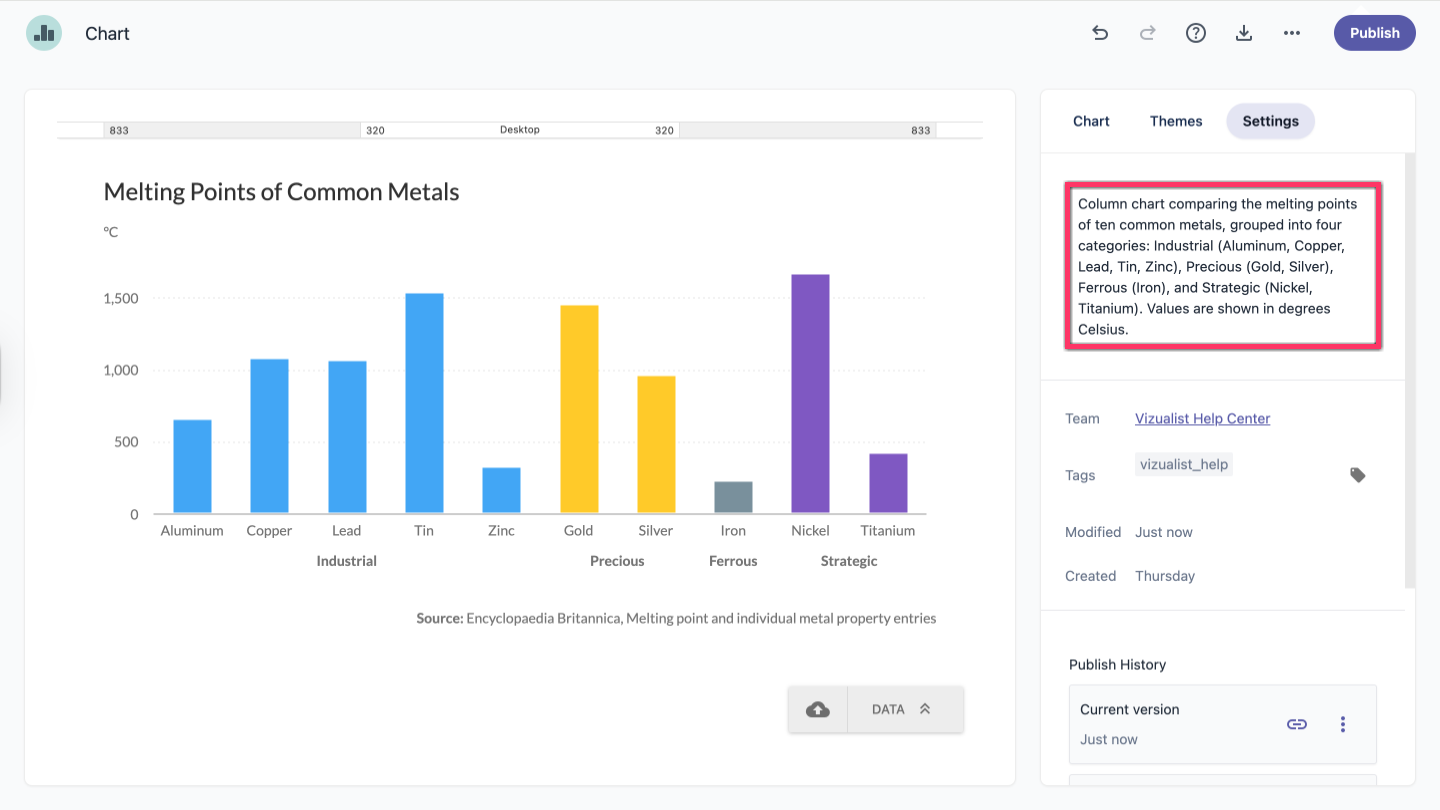
A description helps you and your collaborators quickly understand what a chart is about. To add one, open the settings panel and type your text in the Description field.
Tags
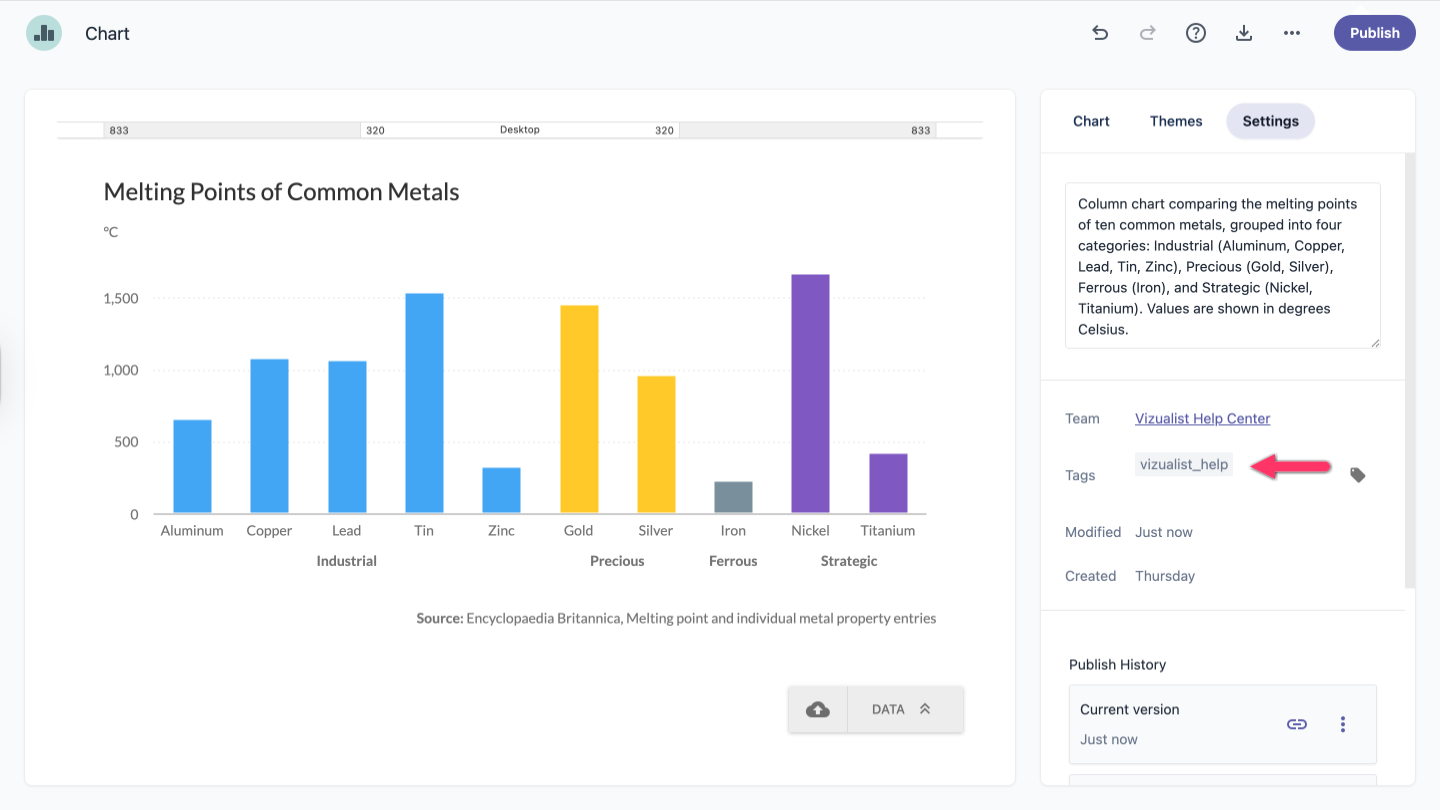
Tags add another layer of identity to your chart, making it easier to group, find, and differentiate charts across your projects.
- When viewing a chart, open the settings panel and click the tag icon .
- From the dropdown, select an existing tag — or, if the tag you need isn't listed, type it in and click +Create.
Publish history
The publish history lets you review previous versions of your chart. From there, you can open any version, mark one to keep permanently, or delete versions you no longer need.